The “Big 6” Elements of a SQL Select Statement#
When querying data in SQL, the SELECT statement is the foundation. It allows you to specify what data to retrieve, from where, and how to organize it. The six key elements (plus LIMIT) are essential to writing powerful queries.
SELECT: Specifies which columns you want to retrieve.
Example:
SELECT customer_id, amount FROM sales;
FROM: Specifies the table you are querying.
WHERE: Filters rows based on conditions.
Example:
SELECT * FROM sales WHERE amount > 100 AND sale_date >= '2023-01-01';Example:
SELECT product_id, amount FROM sales ORDER BY amount DESC;
GROUP BY: Aggregates rows with the same values into summary rows. Useful for metrics like total sales per customer.
HAVING: Filters results of a
GROUP BYclause, similar toWHEREbut for aggregated data.ORDER BY: Sorts the result set. Use
DESCfor descending andASCfor ascending.** LIMIT:** Restricts the number of rows returned in the result set. Often used with ORDER BY to get top or bottom results.
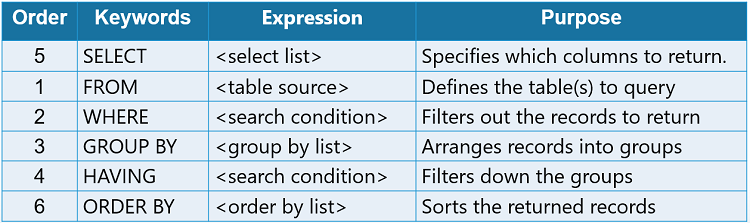
Remember that, although these six key elements (SELECT, FROM, WHERE, GROUP BY, HAVING, ORDER BY) plus LIMIT are essential to writing powerful queries; however, WHERE, GROUP BY, HAVING, ORDER BY, and LIMIT are optional depending on the query’s purpose.
Example: Let’s create the Customers, Products, and Orders tables and insert sample data into each.
# Step 1: Import libraries
import sqlite3
import pandas as pd

# Step 2: Connect to SQLite database
conn = sqlite3.connect('shop_data.db')
cursor = conn.cursor()

# Step 3: Create tables
cursor.execute('''
CREATE TABLE IF NOT EXISTS Customers (
    CustomerID INTEGER PRIMARY KEY,
    Name TEXT,
    Age INTEGER,
    Gender TEXT
);
''')

cursor.execute('''
CREATE TABLE IF NOT EXISTS Products (
    ProductID INTEGER PRIMARY KEY,
    Product_Name TEXT,
    Price REAL
);
''')

cursor.execute('''
CREATE TABLE IF NOT EXISTS Orders (
    OrderID INTEGER PRIMARY KEY,
    CustomerID INTEGER,
    ProductID INTEGER,
    Quantity INTEGER,
    FOREIGN KEY(CustomerID) REFERENCES Customers(CustomerID),
    FOREIGN KEY(ProductID) REFERENCES Products(ProductID)
);
''')
cursor.execute('''
CREATE TABLE IF NOT EXISTS sales (
    order_id INTEGER PRIMARY KEY,
    customer_id INTEGER,
    sale_date TEXT,
    product_id INTEGER,
    amount REAL
);
''')


# Step 4: Insert sample data

sales_data = [
    (1, 101, '2023-01-01', 1, 150.00),
    (2, 102, '2023-01-02', 2, 200.50),
    (3, 101, '2023-01-03', 3, 75.25),
    (4, 103, '2023-01-04', 1, 150.00),
    (5, 102, '2023-01-05', 2, 200.50)
]

cursor.executemany("INSERT OR IGNORE INTO sales VALUES (?, ?, ?, ?, ?)", sales_data)


customers_data = [
    (101, 'Alice', 25, 'F'),
    (102, 'Bob', 30, 'M'),
    (103, 'Charlie', 28, 'M'),
    (104, 'Diana', 22, 'F')
]
cursor.executemany("INSERT OR IGNORE INTO Customers VALUES (?, ?, ?, ?)", customers_data)

products_data = [
    (1, 'Laptop', 1000),
    (2, 'Monitor', 200),
    (3, 'Mouse', 30)
]
cursor.executemany("INSERT OR IGNORE INTO Products VALUES (?, ?, ?)", products_data)

orders_data = [
    (5001, 101, 1, 1),
    (5002, 102, 2, 2),
    (5003, 101, 3, 1),
    (5004, 103, 1, 1),
    (5005, 104, 2, 1)
]
cursor.executemany("INSERT OR IGNORE INTO Orders VALUES (?, ?, ?, ?)", orders_data)

conn.commit()
print("Tables created and sample data inserted successfully!")
Tables created and sample data inserted successfully!
1. SELECT#
Specifies which columns you want to retrieve from a table. Example:
SELECT customer_id, amount
FROM sales;
query_select = "SELECT * FROM sales;"
df_select = pd.read_sql_query(query_select, conn)
print(df_select)
   order_id  customer_id   sale_date  product_id  amount
0         1          101  2023-01-01           1  150.00
1         2          102  2023-01-02           2  200.50
2         3          101  2023-01-03           3   75.25
3         4          103  2023-01-04           1  150.00
4         5          102  2023-01-05           2  200.50
2. FROM#
Specifies the table(s) you are querying.
SELECT customer_id, amount
FROM sales;
query_select = "SELECT customer_id, amount FROM sales;"
df_select = pd.read_sql_query(query_select, conn)
print(df_select)
   customer_id  amount
0          101  150.00
1          102  200.50
2          101   75.25
3          103  150.00
4          102  200.50
3. WHERE#
Filters rows based on conditions. Only rows that satisfy the condition are returned.
SELECT *
FROM sales
WHERE amount > 100 AND sale_date >= '2023-01-01';
query_select = "SELECT * FROM sales WHERE amount > 100 AND sale_date >= '2023-01-01'"
df_select = pd.read_sql_query(query_select, conn)
print(df_select)
   order_id  customer_id   sale_date  product_id  amount
0         1          101  2023-01-01           1   150.0
1         2          102  2023-01-02           2   200.5
2         4          103  2023-01-04           1   150.0
3         5          102  2023-01-05           2   200.5
4. GROUPBY#
Aggregates rows with the same values into summary rows, such as totals, averages, or counts.
SELECT customer_id, SUM(amount) AS total_sales
FROM sales
GROUP BY customer_id;
query_select = """
SELECT customer_id, SUM(amount) AS total_sales
FROM sales
GROUP BY customer_id;
"""
df_select = pd.read_sql_query(query_select, conn)
print(df_select)
   customer_id  total_sales
0          101       225.25
1          102       401.00
2          103       150.00
5. HAVING#
Filters results after aggregation. Similar to WHERE, but operates on aggregated data.
Remember, while WHERE filters raw rows before aggregation, HAVING filters groups created by GROUP BY.
Connection to GROUP BY:
GROUP BYcreates aggregated groups (e.g., total sales per customer).HAVINGapplies conditions on these aggregated values. WithoutGROUP BY,HAVINGcan still work on aggregate functions applied to the entire table.
SELECT customer_id, SUM(amount) AS total_sales
FROM sales
GROUP BY customer_id
HAVING SUM(amount) > 100;
query_select = """
SELECT customer_id, SUM(amount) AS total_sales
FROM sales
GROUP BY customer_id
HAVING SUM(amount) > 100;
"""
df_select = pd.read_sql_query(query_select, conn)
print(df_select)
   customer_id  total_sales
0          101       225.25
1          102       401.00
2          103       150.00
6. ORDERBY#
Sorts the result set by one or more columns.
SELECT product_id, amount
FROM sales
ORDER BY amount DESC; -- DESC for descending, ASC for ascending
query_select = """
SELECT product_id, amount
FROM sales
ORDER BY amount DESC;
"""
df_select = pd.read_sql_query(query_select, conn)
print(df_select)
   product_id  amount
0           2  200.50
1           2  200.50
2           1  150.00
3           1  150.00
4           3   75.25