SQL JOINs: Combining Data from Multiple Tables#
In relational databases, data is often split across multiple tables. JOINs allow you to combine rows from two or more tables based on related columns (usually keys).
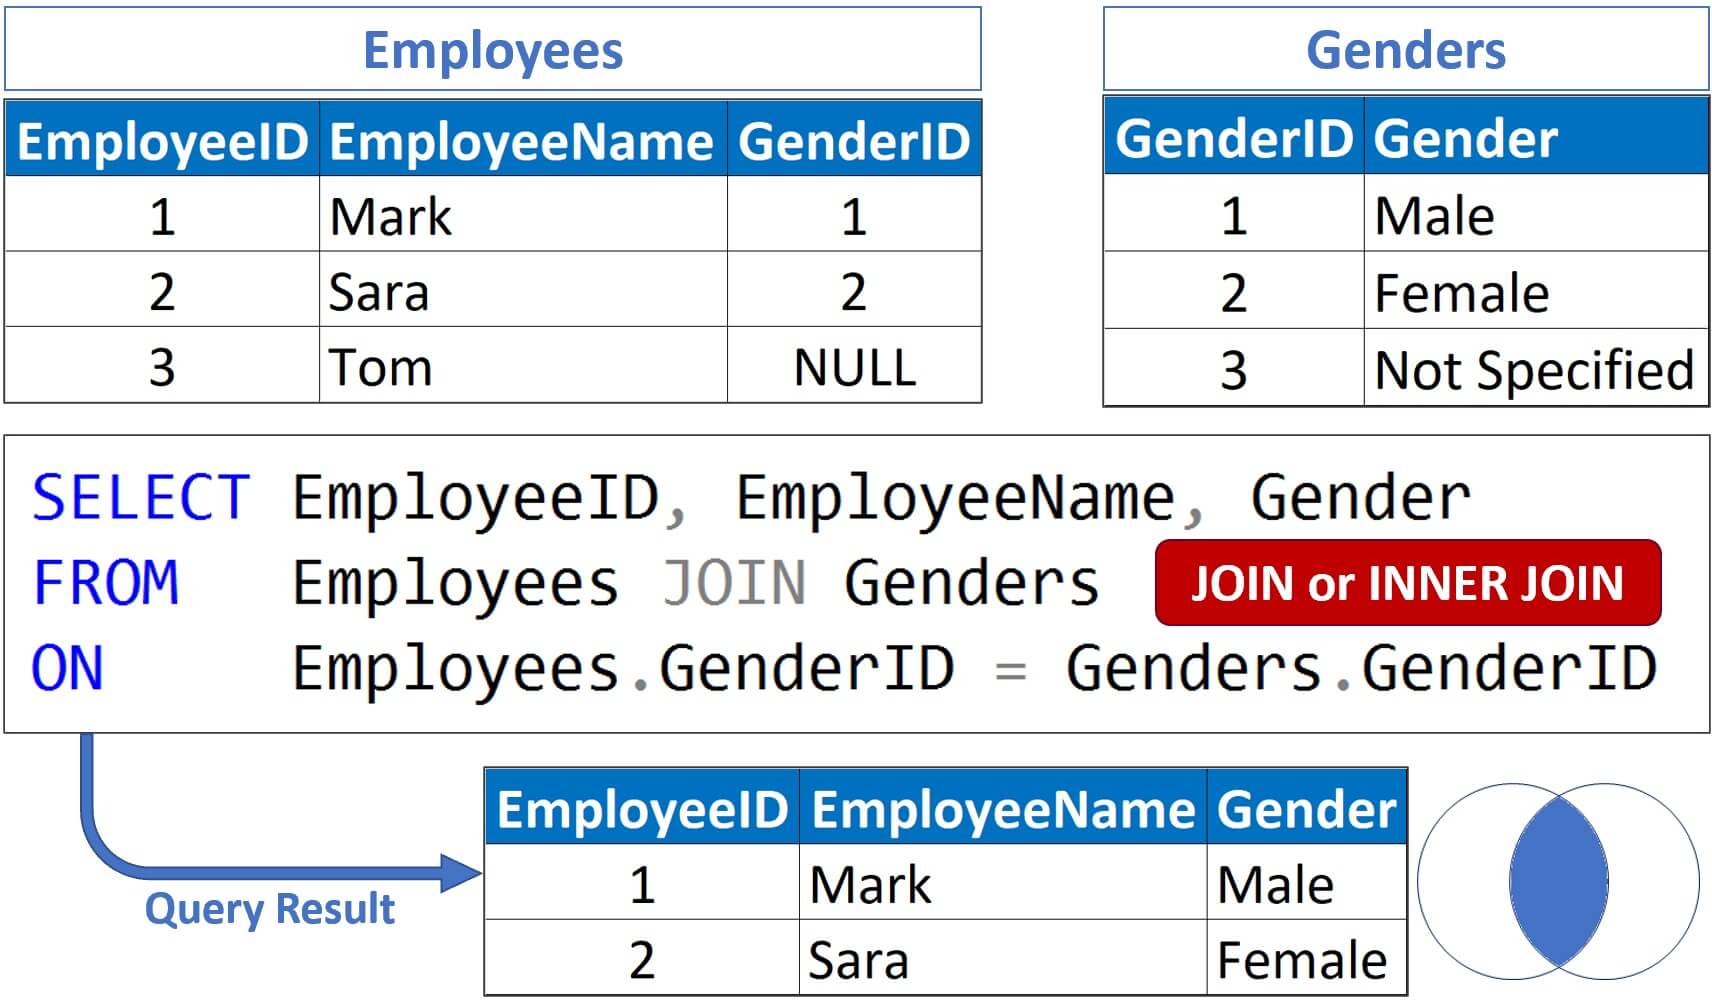
1. INNER JOIN#
Returns only the rows where there is a match in both tables.
SELECT o.Order_ID, c.Name, p.Product_Name
FROM Orders o
INNER JOIN Customers c
    ON o.Customer_ID = c.CustomerID
INNER JOIN Products p
    ON o.Product_ID = p.ProductID;
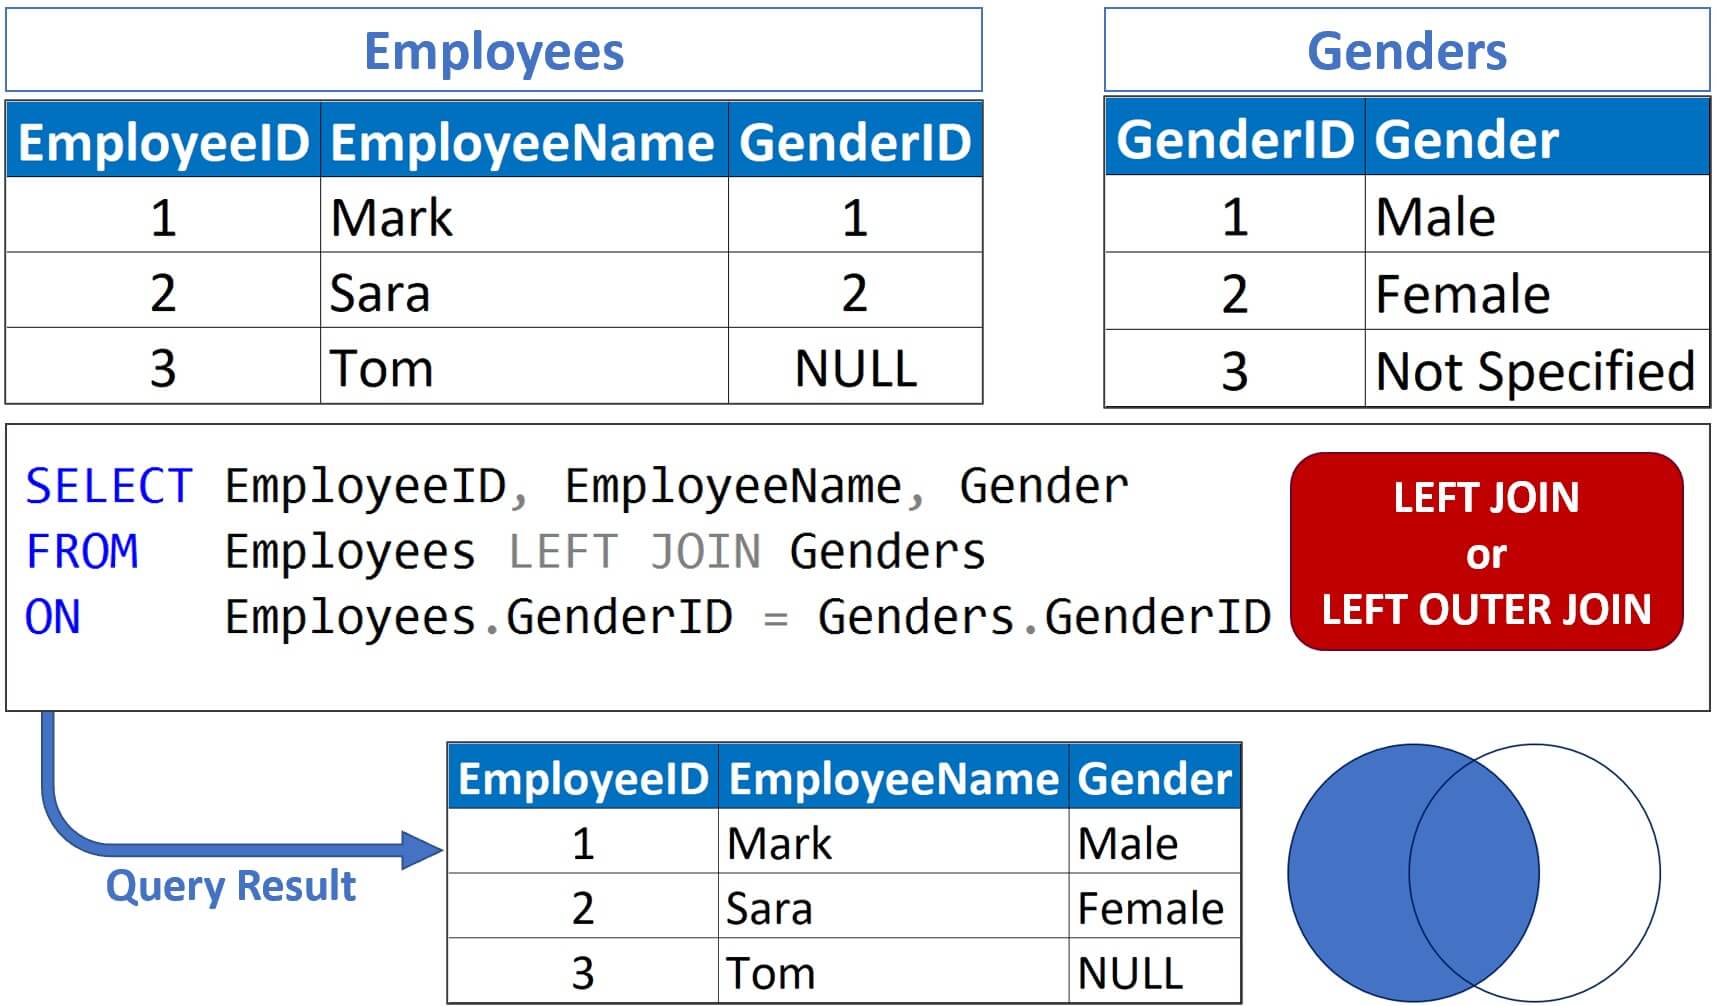
2. LEFT JOIN (or LEFT OUTER JOIN)#
Returns all rows from the left table, and matched rows from the right table. If there is no match, the right table columns return NULL.
SELECT o.Order_ID, c.Name, p.Product_Name
FROM Orders o
INNER JOIN Customers c
    ON o.Customer_ID = c.CustomerID
INNER JOIN Products p
    ON o.Product_ID = p.ProductID;
Here:
All customers are shown, even if they haven’t placed any orders.
Orders columns for customers with no orders will be NULL.
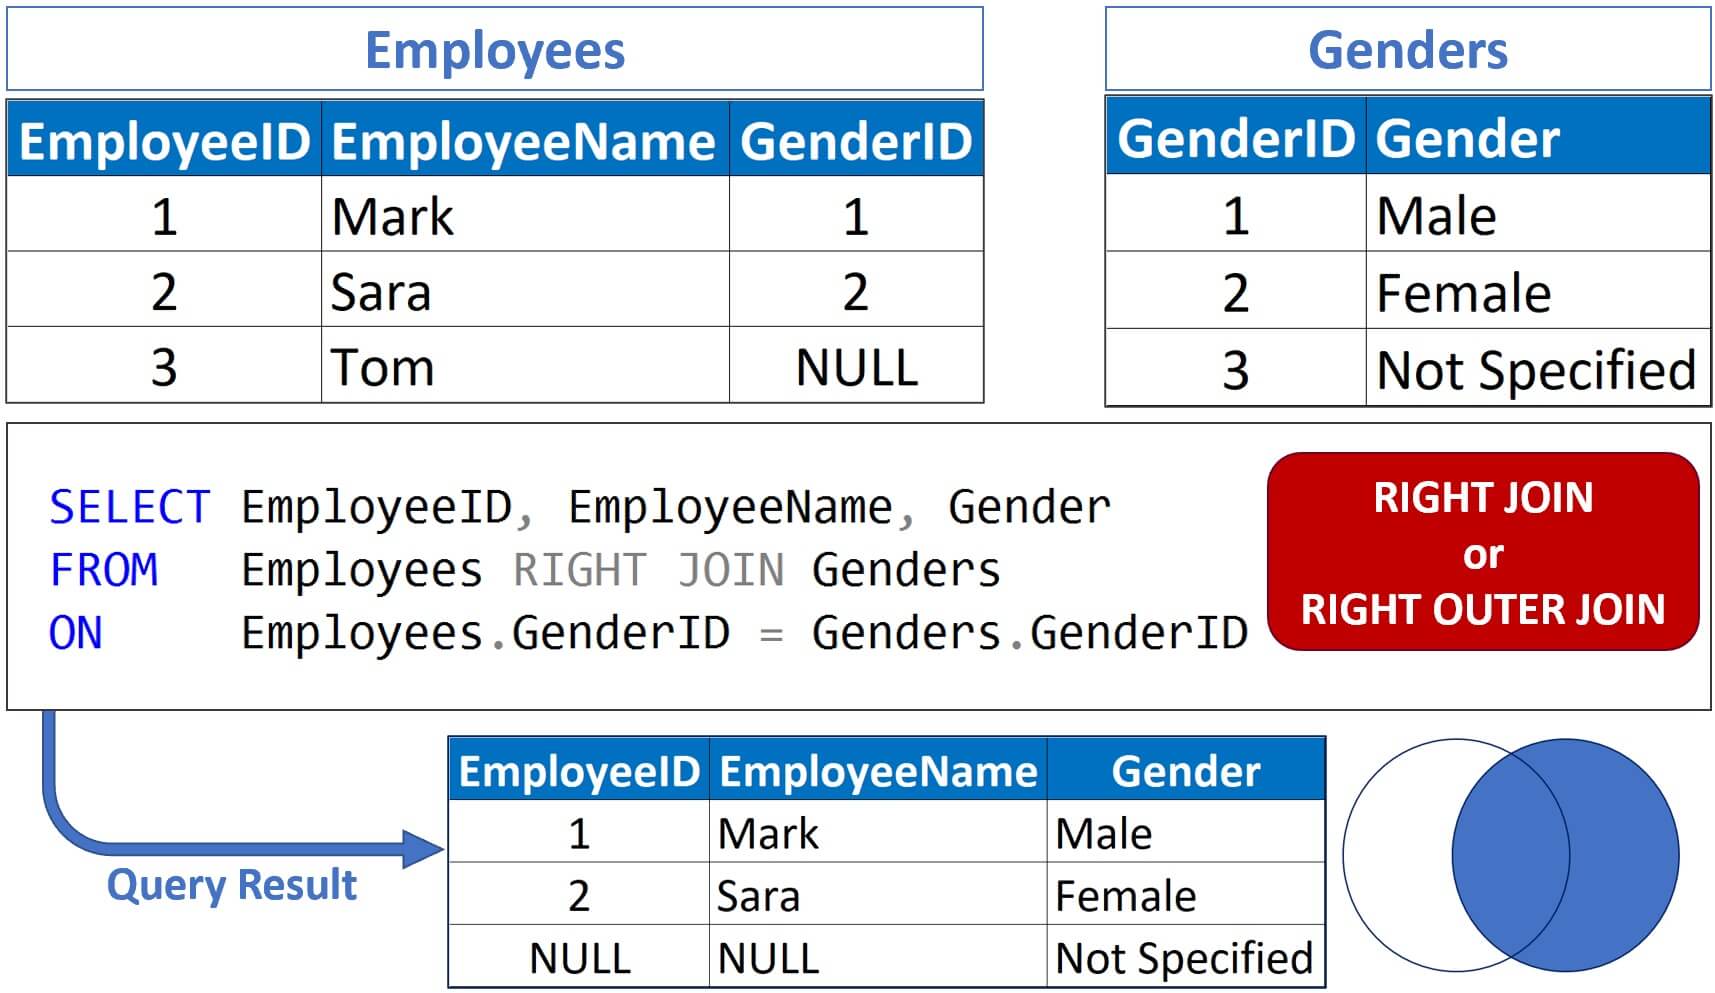
3. RIGHT JOIN (or RIGHT OUTER JOIN)#
Returns all rows from the right table, and matched rows from the left table. If there is no match, the left table columns return NULL.
SELECT o.Order_ID, c.CustomerID, c.Name
FROM Orders o
RIGHT JOIN Customers c
    ON o.Customer_ID = c.CustomerID;
Here, All customers appear, even if they have no orders (similar to LEFT JOIN but reversed table order).
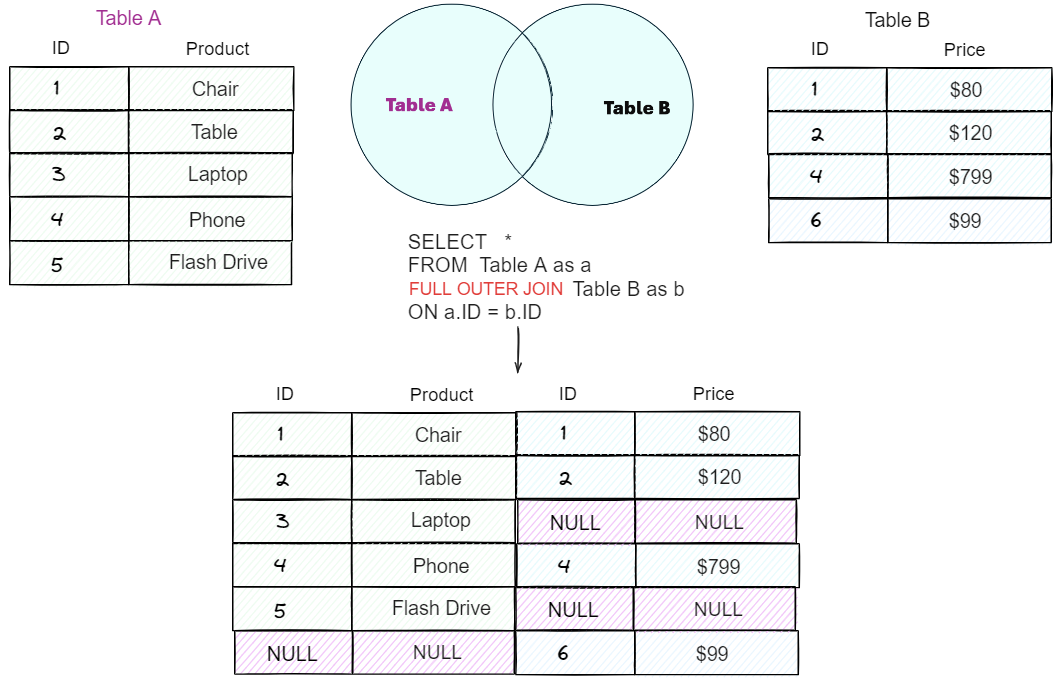
4. FULL OUTER JOIN#
Returns all rows from both tables, with NULL for missing matches on either side.
SELECT c.CustomerID, c.Name, o.Order_ID
FROM Customers c
FULL OUTER JOIN Orders o
    ON c.CustomerID = o.Customer_ID;
Here, we combines the effect of LEFT and RIGHT JOIN. Customers without orders and orders without customers are included with NULL in the missing columns.
Below is a full example of creating and manipulating a table in SQL.
EXAMPLE:#
# Step 1: Import necessary libraries
import sqlite3
import pandas as pd

# Step 2: Connect to a SQLite database
conn = sqlite3.connect('sales_data.db')
cursor = conn.cursor()

# Step 3: Create tables
cursor.execute('''
CREATE TABLE IF NOT EXISTS sales (
    order_id INTEGER PRIMARY KEY,
    customer_id INTEGER,
    product_id INTEGER,
    sale_date TEXT,
    amount REAL
);
''')

cursor.execute('''
CREATE TABLE IF NOT EXISTS products (
    product_id INTEGER PRIMARY KEY,
    product_name TEXT
);
''')

# Step 4: Insert data
sales_data = [
    (1, 101, 1, '2023-01-01', 150.00),
    (2, 102, 2, '2023-01-02', 200.50),
    (3, 101, 3, '2023-01-03', 75.25),
    (4, 103, 1, '2023-01-04', 150.00),
    (5, 102, 2, '2023-01-05', 200.50)
]
cursor.executemany("INSERT OR IGNORE INTO sales VALUES (?, ?, ?, ?, ?)", sales_data)

products_data = [
    (1, 'Laptop'),
    (2, 'Monitor'),
    (3, 'Mouse')
]
cursor.executemany("INSERT OR IGNORE INTO products VALUES (?, ?)", products_data)

conn.commit()
print("Database populated successfully!")

# Step 5: Simple SQL query
query_1 = "SELECT * FROM sales WHERE amount > 150;"
df_high_sales = pd.read_sql_query(query_1, conn)
print("\n--- Sales with Amount > $150 ---")
print(df_high_sales)

# Step 6: JOIN query
query_2 = """
SELECT s.order_id, s.sale_date, s.amount, p.product_name
FROM sales AS s
JOIN products AS p
ON s.product_id = p.product_id;
"""
df_sales = pd.read_sql_query(query_2, conn)
print("\n--- Sales with Product Names ---")
print(df_sales)

# Step 7: GROUP BY query
query_3 = """
SELECT customer_id, SUM(amount) AS total_amount
FROM sales
GROUP BY customer_id
ORDER BY total_amount DESC;
"""
df_summary = pd.read_sql_query(query_3, conn)
print("\n--- Total Sales per Customer ---")
print(df_summary)

# Step 8: HAVING query (filter aggregated results)
query_4 = """
SELECT customer_id, SUM(amount) AS total_amount
FROM sales
GROUP BY customer_id
HAVING SUM(amount) > 200
ORDER BY total_amount DESC;
"""
df_having = pd.read_sql_query(query_4, conn)
print("\n--- Customers with Total Sales > $200 ---")
print(df_having)

# Step 9: Close connection
conn.close()
print("\nConnection to database closed.")
Database populated successfully!

--- Sales with Amount > $150 ---
   order_id  customer_id  product_id   sale_date  amount
0         2          102           2  2023-01-02   200.5
1         5          102           2  2023-01-05   200.5

--- Sales with Product Names ---
   order_id   sale_date  amount product_name
0         1  2023-01-01  150.00       Laptop
1         2  2023-01-02  200.50      Monitor
2         3  2023-01-03   75.25        Mouse
3         4  2023-01-04  150.00       Laptop
4         5  2023-01-05  200.50      Monitor

--- Total Sales per Customer ---
   customer_id  total_amount
0          102        401.00
1          101        225.25
2          103        150.00

--- Customers with Total Sales > $200 ---
   customer_id  total_amount
0          102        401.00
1          101        225.25

Connection to database closed.