How Is Data Organized or Stored?#
So far, we have described data based on what it represents (quantitative vs. qualitative). Data science also cares about a different and equally important dimension: how the data is organized for computation. The structure of data influences how easily it can be stored, queried, cleaned, and analyzed.
Unlike quantitative/qualitative categories (which describe meaning), structural categories describe the shape and format of data.
In data science, the key difference isn’t what the data is made of (numbers, pixels, words), but how it is organized. In practice, we encounter three major structural families:
Structured data: rigid, organized, predictable
Semi-structured data: flexible, loosely organized
Unstructured data: non-tabular data (such as text, images, audio, and video) without a predefined schema that does not fit neatly into tables
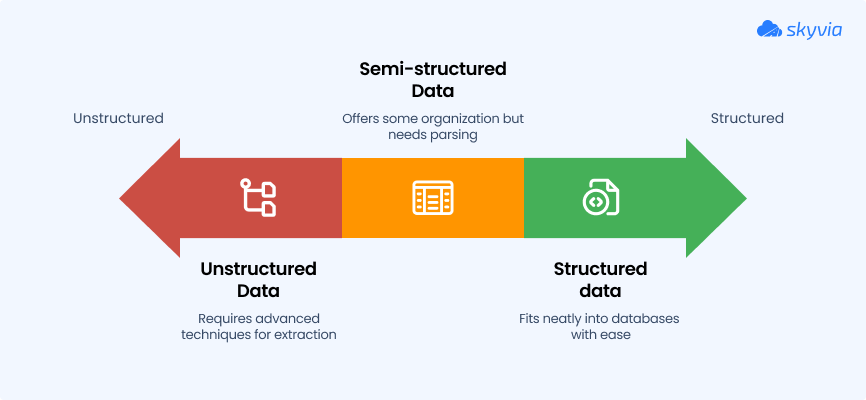

Figure 2. Structured, Semi-Structured, and Unstructured data formats. Source: Skyvia
These categories apply to text, numbers, images, audio, and almost any modern dataset. Each category demands different tools, techniques, and assumptions.

Figure 3. Comparison of Structured, Semi-Structured, and Unstructured data. Source: Arya.ai
In modern systems, all three often coexist: structured transactional data, semi-structured event logs, and unstructured user content.
1. Structured Data: The Orderly World#
Structured data is neatly organized, predictable, and follows a predefined schema. Structured data behaves politely. It typically appears in tables, with rows and columns, where each field has a specific data type (e.g., integer, string, boolean).
Example structures include:
Tabular data (spreadsheets, CSV files)
Relational databases (PostgreSQL, MySQL)
Time-based or Temporal tables (stock prices, sensor logs)
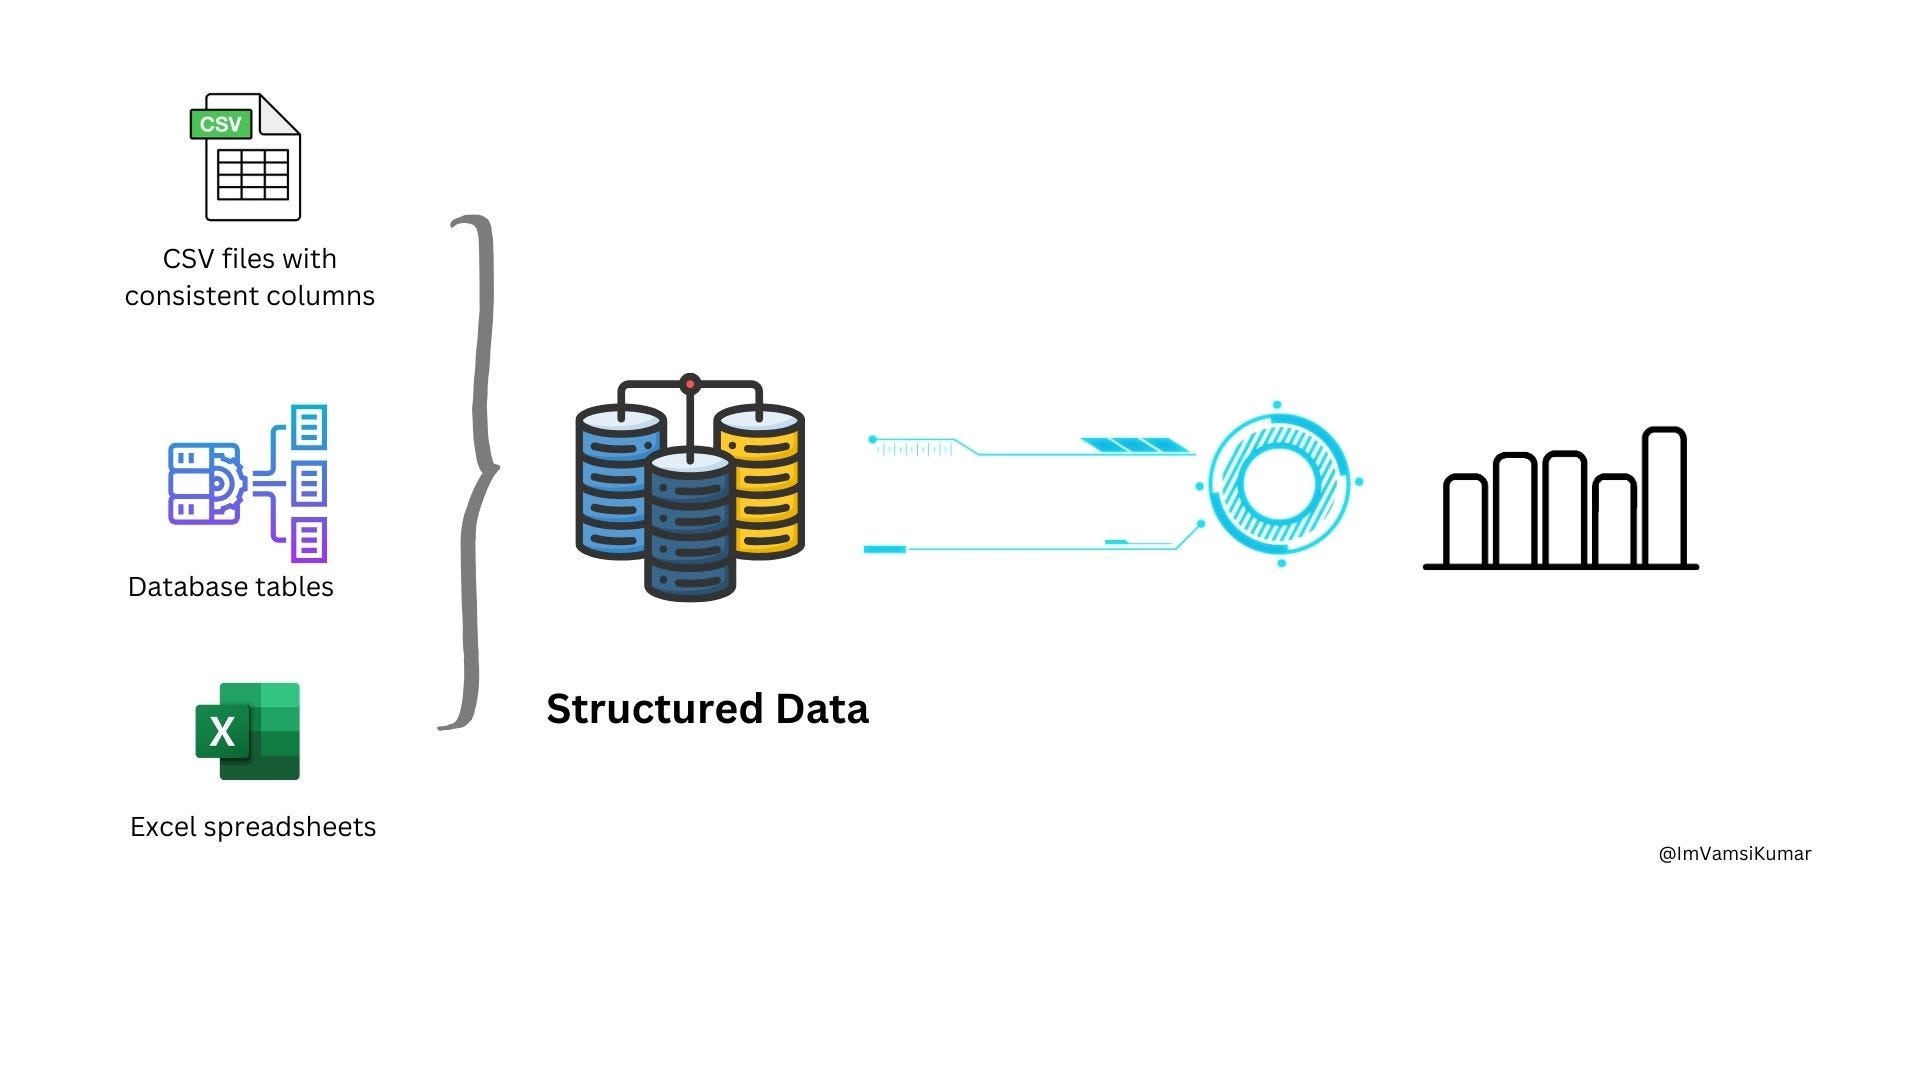
Figure 4. Structure Data. Source: Miro.medium
Structured data is easy to query (SQL), easy to validate, and easy to join across tables. It is the backbone of business analytics and scientific measurement.
(a) Tabular Data: The Spreadsheet World#
Tabular data is what most people picture first, a rectangular grid of rows and columns, familiar from Excel or Pandas. Each row represents an entity, each column a property. A database table of airline flights, for example, might have:
• departure airport
• arrival airport
• time
• delay
• airline

Figure 5. Conceptual diagram illustrating internal structure or hierarchy. Source: Devopedia
There’s a reason the spreadsheet survived decades of technological change: it works. Its shape matches how humans reason about comparisons (Who spent more? Which day had the highest sales?).
(b) Time-Based Data: The Rhythm of Change#
Not everything stays constant. Stock prices drift by the second, weather shapes the day hour by hour, and fitness trackers quietly log your heartbeat as you sleep.
Time-based (or temporal) data puts events in order and lets us ask how something changes rather than merely what it is. Analysts in finance, meteorology, and operations live in this world. The key idea is not the value itself, but the trajectory.
A single temperature reading is trivia; a year of temperature readings reveals climate.

Figure 6. Examples of time-series visualizations showing how values evolve over time. Source: ChartExpo
Temporal data allows us to detect trends (upward/downward), cycles (seasonal patterns), anomalies (abrupt changes), and responses to interventions (before/after effects). Many forecasting tasks—from weather to sales to traffic—are built on time-series models.
2. Semi-Structured Data: The Flexible Middle#
Semi-structured data does not fit neatly into tables (doesn’t prescribe fixed column) , but it still contains markers, tags, or key-value pairs that impose some level of organization (structure and hierarchy).
Common examples include:
JSON (web APIs, configuration data)
XML and HTML (documents and web pages)
logs (server events, application traces)
key-value pairs (NoSQL databases)
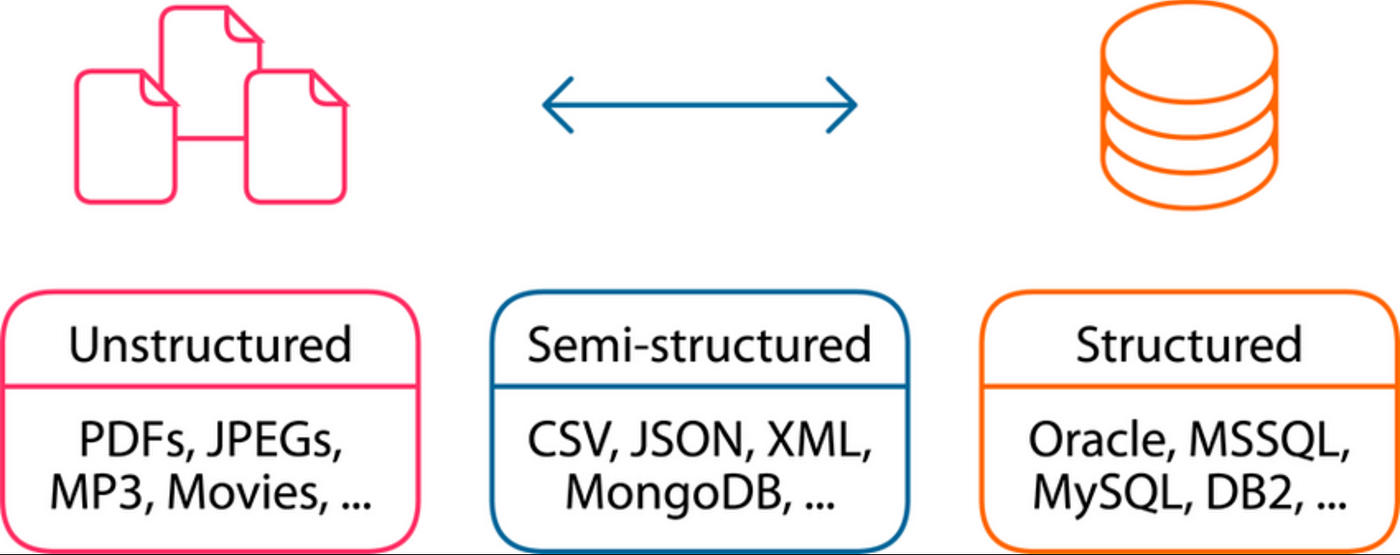
Figure 7. Semi-structured data can be represented using JSON,XML etc. Source: Medium (miro.medium.com)
Semi-structured data is more flexible than structured data. It supports nesting and irregular formats, which is why modern web APIs and mobile apps use JSON extensively.
3. Unstructured Data: The Untamed Majority#
Most digital information refuses to sit neatly in tables or hierarchical tags. This is unstructured data, and it now dominates the modern world.
Unstructured data lacks a predefined schema and is difficult to store in rows and columns. It includes rich media, human language, and other natural forms of expression.
Examples include:
images (satellite photos, medical scans, selfies)
audio (voice commands, music, podcasts)
video (streaming content, surveillance footage)
text (tweets, emails, reviews, articles)
graphs of social or biological networks
For decades, computers couldn’t make sense of this category. The recent boom in machine learning, NLP for text, CNNs for images, transformers for everything, is largely about taming unstructured information.
(a) Images: Data You Can See#
A picture is not a number, until a model turns it into one.
Images are deceptively simple. What we perceive as a photograph is actually a grid of pixels, tiny squares holding values for red, green, and blue. Those values range from 0 to 255 and describe how bright each channel should appear.
Image formats involve trade-offs: JPEG compresses aggressively and loses some detail; PNG preserves every pixel; medical imaging prefers lossless formats because a mistake isn’t aesthetic, it’s scientific.
Compression, resolution, and color channels are not trivia. They determine how algorithms “see.”
Special Case of Data: “Graphs” — Data with Relationships#
Some data is best understood through relationships, not just individual values. A social network, a map of roads, or protein interactions inside a cell are examples.
Graphs introduce their own structure:
nodes represent objects (e.g., people, airports, proteins)
edges represent relationships (e.g., friendships, flights, bindings)
The power lies in the pattern of connections rather than the elements themselves. Who follows whom? Which cities connect? Which proteins interact? Influence, connectivity, centrality, and path structure become more important than single values.
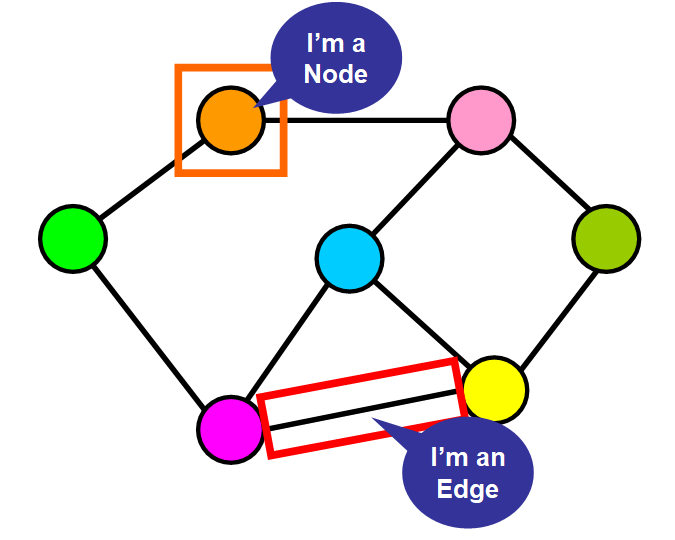
Figure 8. Example graph representation showing nodes connected by edges. Source: freeCodeCamp
Why Data Structure Matters#
Data structure determines:
how easily data can be queried and indexed
what tools or languages we use (SQL vs. parsers vs. ML models)
how expensive or difficult preprocessing becomes
how storage systems are designed (databases vs. file systems vs. cloud object stores)
For example, structured data works well with SQL and joins. Semi-structured data works well with hierarchical queries and document stores. Unstructured data may require embeddings, tokenization, image processing, or deep learning.
Modern data systems often mix all three. A single application may store user profiles in a relational table, telemetry in a JSON log, and user photos as unstructured images.