The Data Science Life Cycle#
Now that we have a sense of where data science came from, it is helpful to look at how it actually works in practice. Different organizations may have their own variations, but most data science projects follow a similar life cycle. The goal of this process is to move from raw data to insight, decisions, and value.
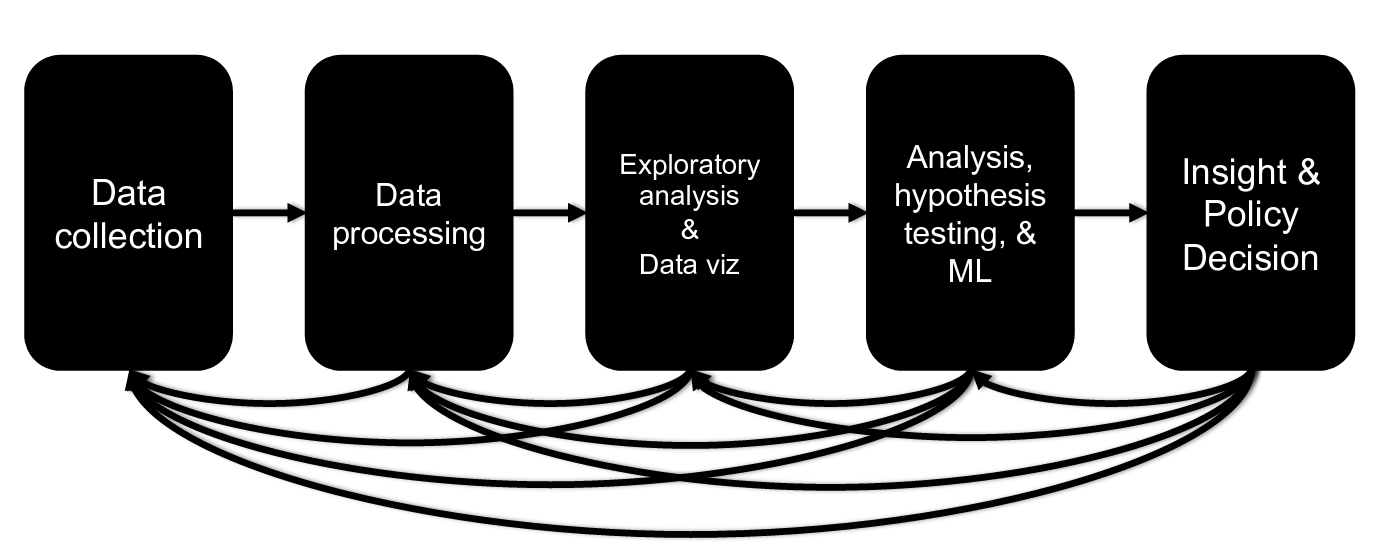
Figure 7: Data Science Life Cycle (DSLC). Source: Dr. John Dickerson
Step I: Data Collection#
The life cycle typically begins with data collection — gathering information from available sources. Data may come from sensors, surveys, transaction systems, public datasets, or internal databases. Data can be:
Primary data, collected directly for the project (e.g., surveys, experiments, field observations, sensors).
Secondary data, which already exists and was collected for another purpose (e.g., public datasets, social media, administrative records).
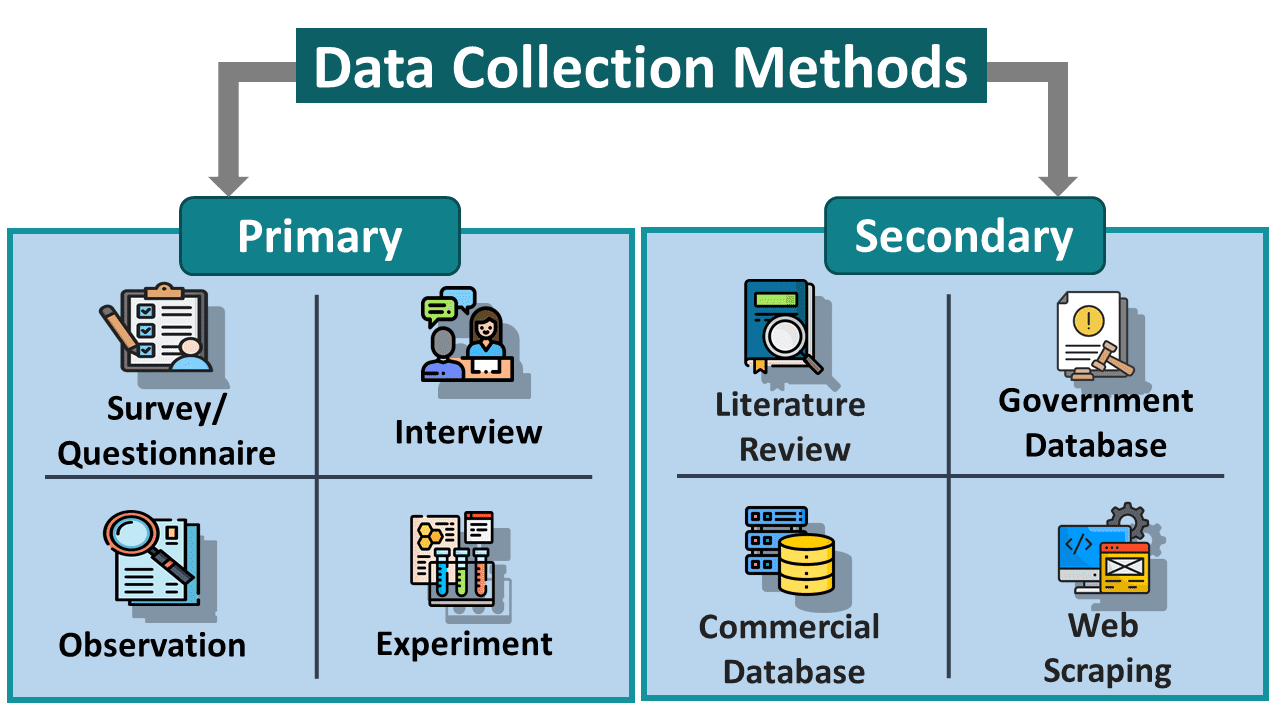
Figure 8: Common data collection methods. Source: EDUCBA
Why it matters: Primary data is highly relevant but often costly and time-consuming. Secondary data is faster and cheaper to obtain, but may not perfectly match the analysis goals or may require additional cleaning and assumptions.
In practice, analysts often blend both types. For example, a public health researcher might conduct new surveys (primary) while using census data for context (secondary).
Step II: Data Processing#
Once collected, data rarely arrives in clean form. Data processing involves organizing, cleaning, and transforming raw data so that it can support analysis. This may include fixing errors, handling missing values, resolving inconsistencies, or merging multiple datasets. Feature engineering often occurs here to create variables that better capture relevant relationships.
Why it matters: Clean, well-structured data increases the chance of extracting meaningful insights and prevents misleading results. Processing often consumes a large portion of a project.
Analysts frequently iterate between processing and earlier steps as data gaps or issues emerge.
Step III: Exploratory Data Analysis (EDA)#
With processed data, EDA helps analysts explore patterns, distributions, correlations, and anomalies. Techniques include descriptive statistics and visualizations. For example, an analyst might examine the relationship between study hours and test scores by calculating average scores, looking at score ranges, and noticing that some students performed exceptionally well.
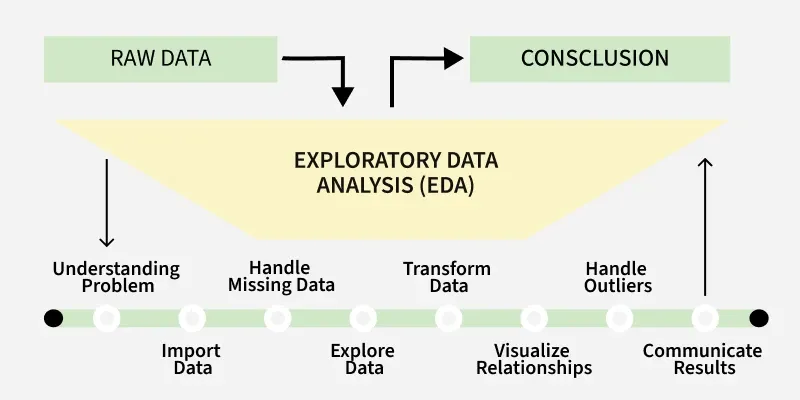
Figure 9: Illustrative example of Exploratory Data Analysis (EDA). Source: GeeksforGeeks.
Visualization can make these patterns clearer. Plotting study hours against average scores may reveal that students who study more tend to achieve higher scores—a useful pattern that might inform later modeling.
Why it matters: EDA guides the rest of the project. It shapes hypotheses, informs modeling choices, and reveals data limitations.
EDA often sends analysts back to processing or even data collection to refine inputs.
Step IV: Analysis and Modeling#
Next, the project moves into analysis and modeling, which may involve statistical inference or machine learning. The goal is to either explain current patterns or predict future outcomes, depending on the context.
Why it matters: Modeling provides structure and rigor. It allows relationships to be quantified and predictions to be made—insights that may be difficult to detect through raw inspection alone.
Step V: Insight and Decision-Making#
Finally, results must be translated into decisions, recommendations, or actions. This may involve policy suggestions, business strategies, scientific findings, or product improvements. Clear communication is essential, as stakeholders often are not technical experts.
Why it matters: The value of data science is realized only when insights lead to decisions. A sophisticated model has little impact if it does not shape understanding or drive action.
Decision-making often generates new questions, sending the project back to earlier steps.
A Simple Example#
Consider a city trying to improve traffic flow. It might collect data from sensors (collection), clean and merge logs (processing), explore patterns (EDA), build a model to predict congestion (analysis and modeling), and adjust traffic policies (decision-making). After implementation, new data arrives and the cycle repeats.
A Key Reminder#
Data science is not a strictly one-way, linear process; it is dynamic, iterative, and adaptive.
In real projects, analysts often loop backward — re-cleaning data, adjusting models, re-thinking assumptions, or requesting new data. The process behaves more like a feedback loop than an assembly line.