Key Ideas in Experimental Design#
Although experimental design is a broad field, several concepts appear repeatedly in data science applications:
(I) Hypothesis & Research Question#
Asking the Right Question#
Every experiment begins with a question, and asking the right question is important. This is the big-picture motivation behind why we run an experiment at all. It focuses on decision-making, usefulness, and purpose.
“Data is the new science. Big Data holds the answers. Are you asking the right questions?”
— Patrick P. Gelsinger, Former CEO of Intel
A data science project is only as valuable as the question it answers. In practice, these questions can have different decision goals. Some questions are simple and descriptive, while others help us make better decisions.
Different Decision Goals in Data Science#
Decision Goal |
Core Question |
Purpose |
Example (same scenario) |
|---|---|---|---|
Descriptive |
What happened? |
Summarizes past or current state |
“Sales dropped last week.” |
Diagnostic |
Why did it happen? |
Explains patterns and associations (not causal) |
“Sales dropped because shipping was slow.” |
Predictive |
What will happen next? |
Forecasts future outcomes |
“If shipping stays slow, sales will continue to drop.” |
Causal |
What is the effect of doing X? |
Identifies cause–effect relationships under interventions |
“Speeding up shipping increases sales.” |
Prescriptive / Optimization |
What should we do? |
Chooses the best action to achieve a desired outcome |
“Speeding up shipping is the best way to increase sales.” |
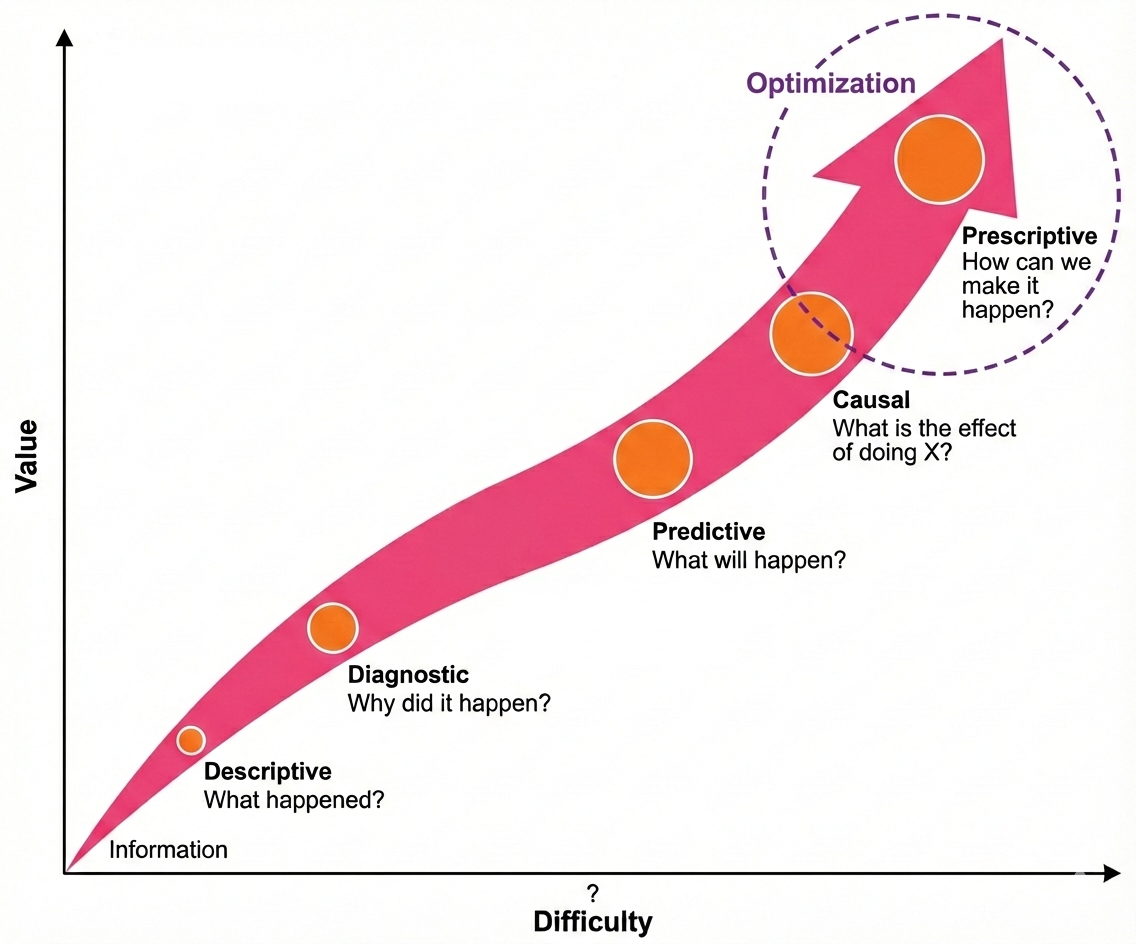
Figure 2: Hierarchy of decision goals in data science and analytics.
As we move from descriptive to diagnostic, predictive, causal, and finally prescriptive/optimization questions, the insights become more useful for real-world decisions, but also harder to answer. Harder questions often require more data, stronger assumptions, better models, and sometimes experiments or interventions to figure out cause and choose the best action.
What is Optimization?
Optimization is about choosing the best action to reach a goal. Goals can vary depending on the context of the problem, such as increasing sales, reducing wait times, improving accuracy, or boosting conversions. Formally, we define an objective ( f(x) ) (something we care about) and choose the option that maximizes or minimizes ( f(x) ).
For example:
“Will showing product reviews increase purchase conversions?”
A tech company might test two landing pages to see which one produces a higher click-through rate (CTR). A hospital might test different rehabilitation schedules to see which one speeds recovery. A city might test new traffic signal timings to reduce congestion.
Connecting Back to Experiments
Before we can optimize, we often need to understand causal effects (e.g., “If we change X, what happens to Y?”). This is where experiments come in. Experiments allow us to compare the results of different actions and see which one performs better.
At this stage, the goal is not to prove anything mathematically. It is simply to clarify what we want to learn and what outcome matters. These questions are later converted into testable hypotheses (null vs. alternative) that allow us to evaluate results.
We will discuss null and alternative hypotheses in a later chapter.
Hypotheses as Structured Guesses#
A hypothesis is a formal educated guess about how changing an input affects an outcome:
If we increase study time, exam scores will increase.
If we reduce friction during checkout, purchases will increase.
Hypotheses do not guarantee truth; they merely propose a relationship worth testing. Good hypotheses are directional (predict how things move), falsifiable (can be wrong), and relevant (connected to the decision at hand).
In data science, hypotheses often serve a practical purpose: they tell us what data to collect and what comparisons matter.
(II) Variables & Outcomes#
Once we have a research question, the next step is to identify the key components of the experiment: what we change, what we control, and what we measure. In experimental design, these are captured through different type of variables and outcomes.
**(a) Control vs. Treatment/Experiemental **
An experiment typically compares:
Control group: receives the baseline experience
Treatment group: receives the new feature or intervention
Differences in outcomes indicate whether the treatment has an effect.
(b) Independent vs. Dependent Variables
In experiements, we identify the variables:
What will be changed or manipulated? (the independent variable)
What will be measured? (the dependent variable)
Example: If a streaming service wants to see if thumbnail style affects user engagement, the thumbnail is the independent variable and engagement (measured as CTR, watch time, or retention) is the dependent variable.
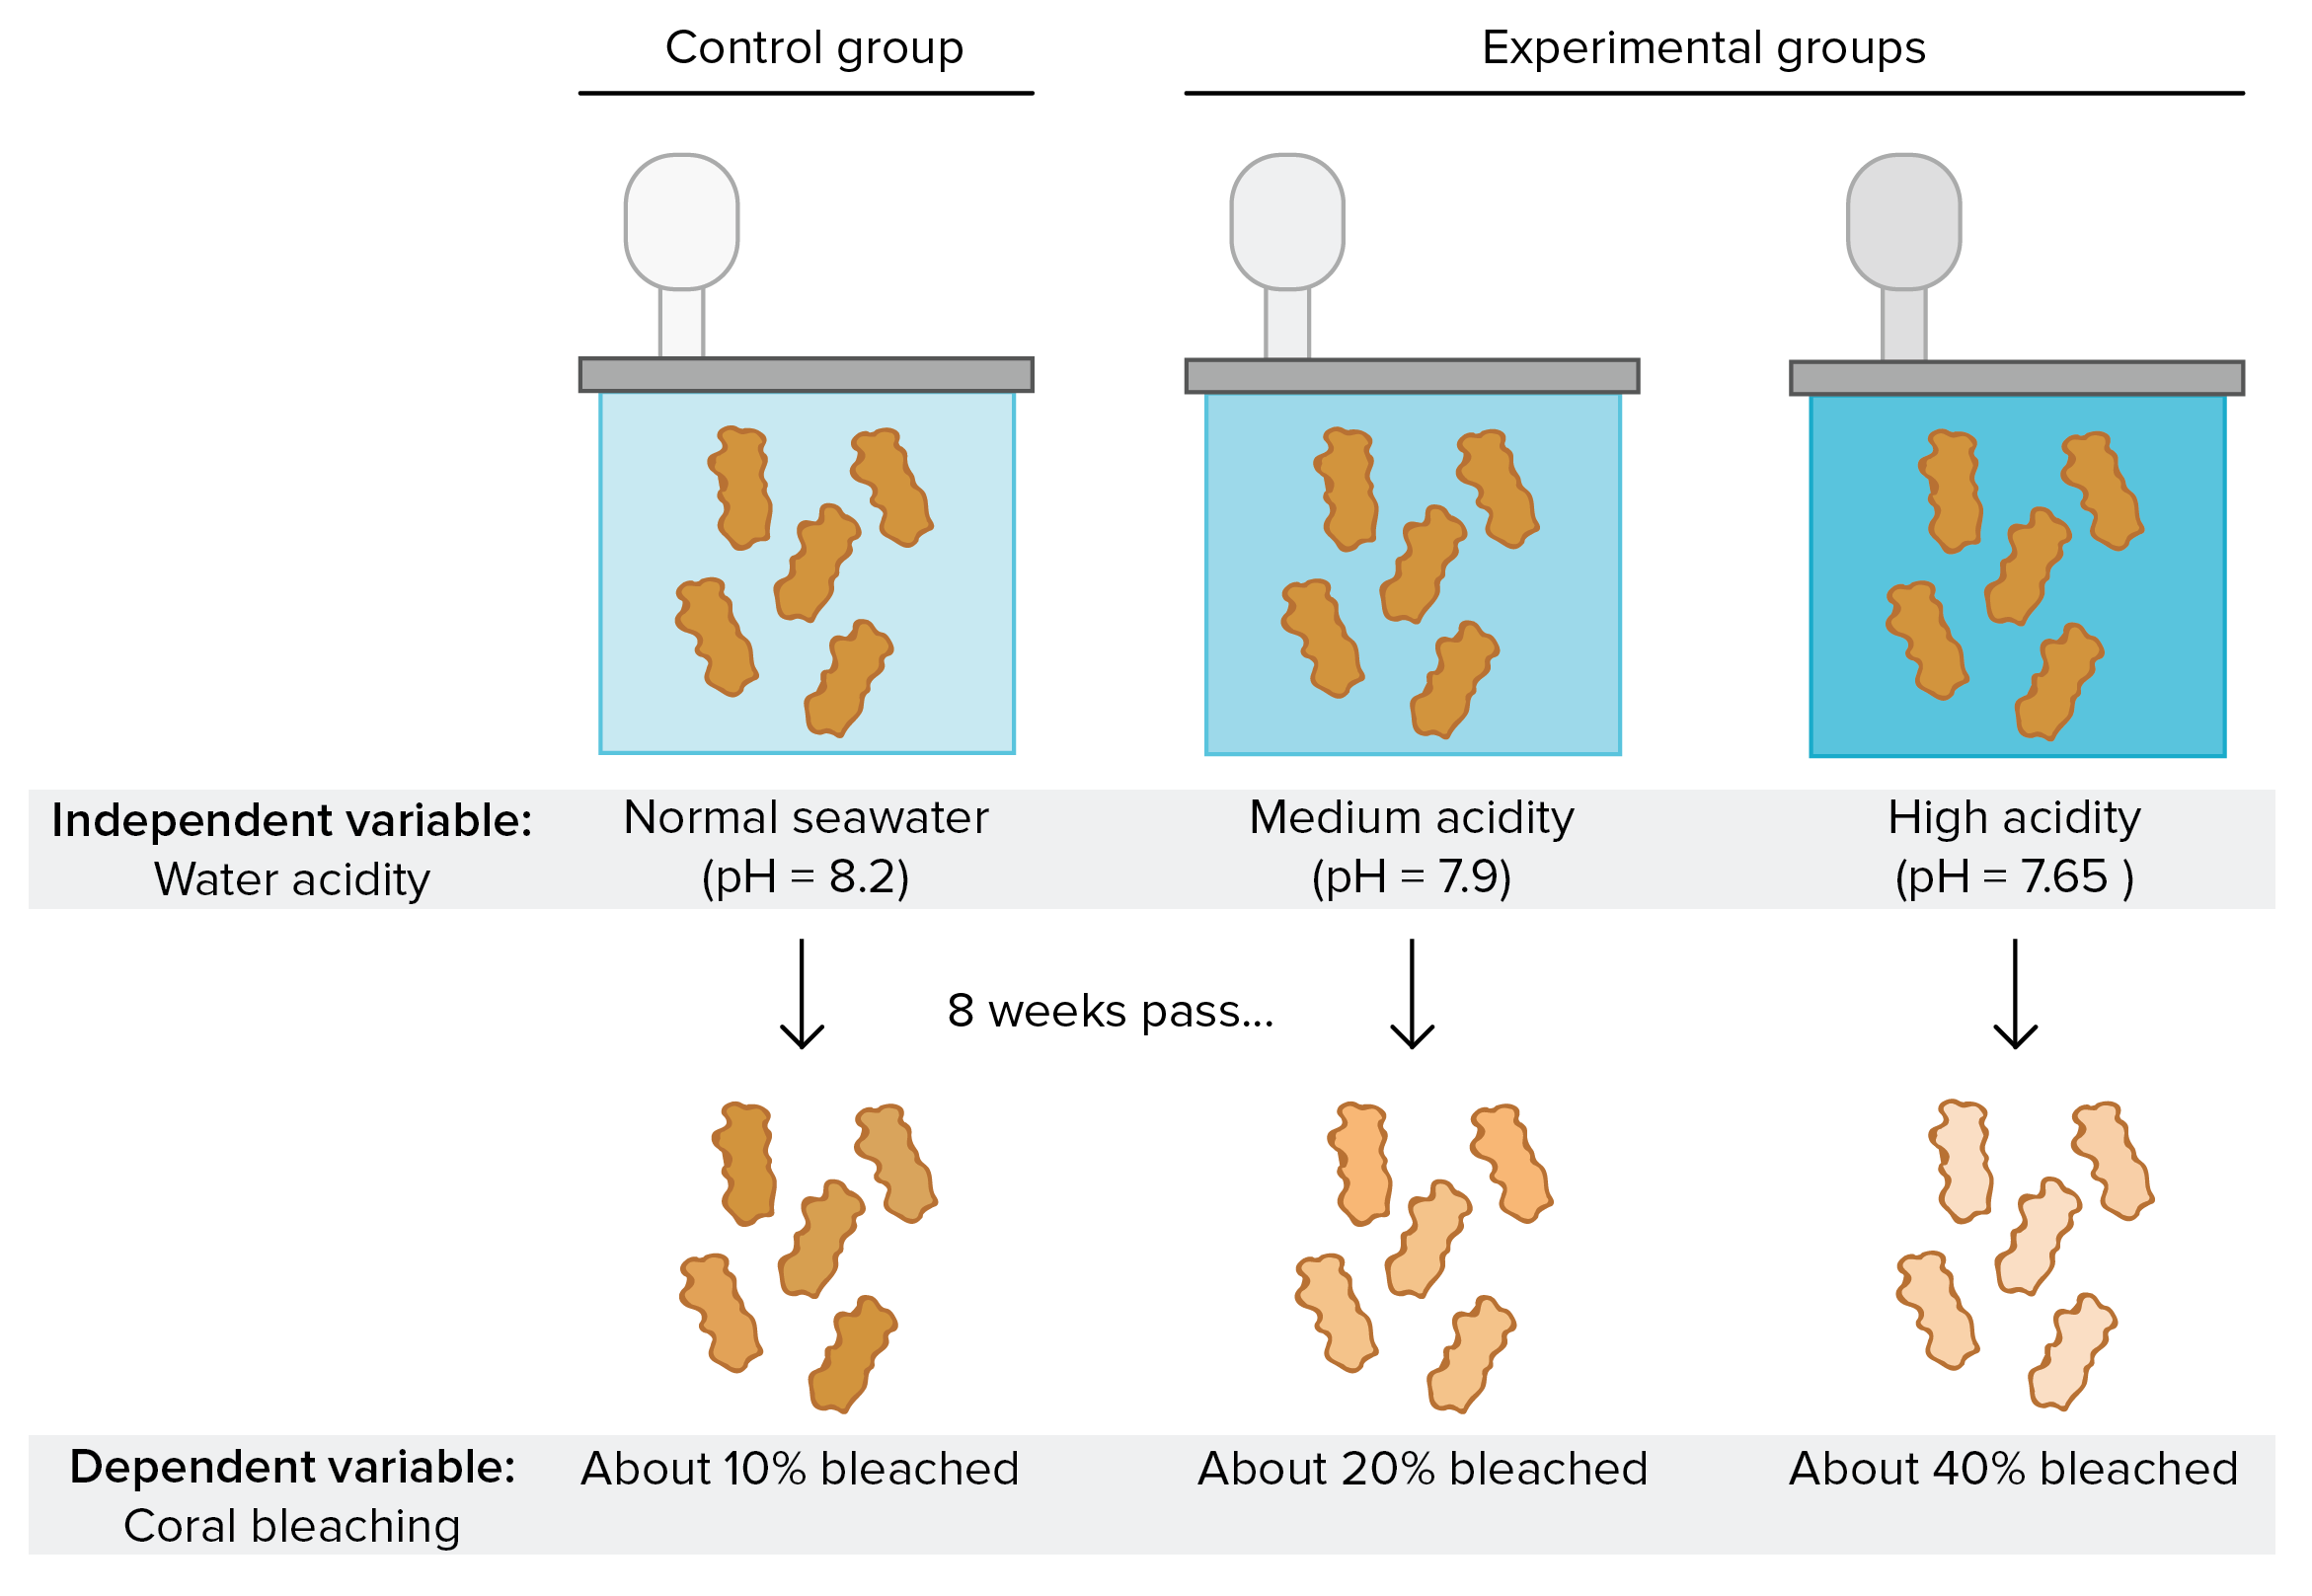
Figure 3. Example diagram showing a comparative setup (e.g., two groups under different conditions or phases of a study). Source: Khan Academy (cdn.kastatic.org)
This mapping matters because a poorly defined outcome leads to wasted experimentation. If you do not know what “better” means, no experiment can tell you what to do.
(c) Metrics / Evaluation Criteria:
Experiments require measurable outcomes; such as:
Click-through rate (CTR)
Revenue
Time on task
Error rate
Completion rate
Good metrics align with the decision being made. And Evaluation Criteria focus on how we quantify success (e.g., revenue per user, conversion rate, latency, retention rate).
In data science, outcomes often relate to optimization goals. For example:
A retailer might measure conversion rate to see if discounts increase sales.
A streaming platform might measure watch time to test a new recommendation algorithm.
A telecom company might measure churn rate to evaluate a loyalty program.
Clearly defining variables and outcomes ensures that the experiment answers the original question and that results can be compared fairly across different groups.
Example: A/B Testing: The Data Science Workhorse#
In industry, the most widely used form of experimentation is A/B testing, where two variants (A = control, B = treatment) are compared.
Examples:
Netflix tests thumbnail images
Amazon tests pricing or layouts
LinkedIn tests recommendation algorithms
TikTok tests ranking models
Meta tests news feed ranking features
What makes A/B testing powerful is its simplicity and scalability, large digital platforms run thousands of concurrent experiments every year.
Practical Example:
Imagine a food delivery app wondering whether offering free delivery for first-time buyers increases conversions.
Control: Users see standard delivery fee.
Treatment: Users see free delivery offer.
Outcome metric: Conversion rate on first purchase.
If the treatment produces a statistically significant increase, the company has evidence to roll it out widely. This logic appears almost everywhere; in UX design, pricing, logistics, healthcare, and public policy.