How Data Science Relates to AI, ML, Deep Learning, and Statistics#
Although the terms AI, machine learning, deep learning, statistics, and data science are often used interchangeably, they refer to different but overlapping ideas. Broadly:
AI focuses on techniques that enable computers to mimic or approximate human intelligence. Example: a chatbot that carries on a conversation or an agent that plays chess.
Machine Learning (ML) is a subset of AI focused on learning patterns from data. Example: predicting house prices based on past sales.
Deep Learning (DL) is a subset of ML that uses neural networks with many layers. Example: recognizing objects in images using convolutional neural networks.
Statistics provides mathematical tools for describing data and making inferences. Example: estimating the average test score of a population from a sample.
Data Science connects statistics and computing to manage, analyze, visualize, and extract insight from data. Example: analyzing customer data to recommend products or forecast demand.
These fields overlap in practice, especially in modern applications where statistical reasoning, computational tools, and learning algorithms work together.
The diagrams below show two common ways these fields are represented visually. Although simplified, they highlight the core relationships and boundaries.
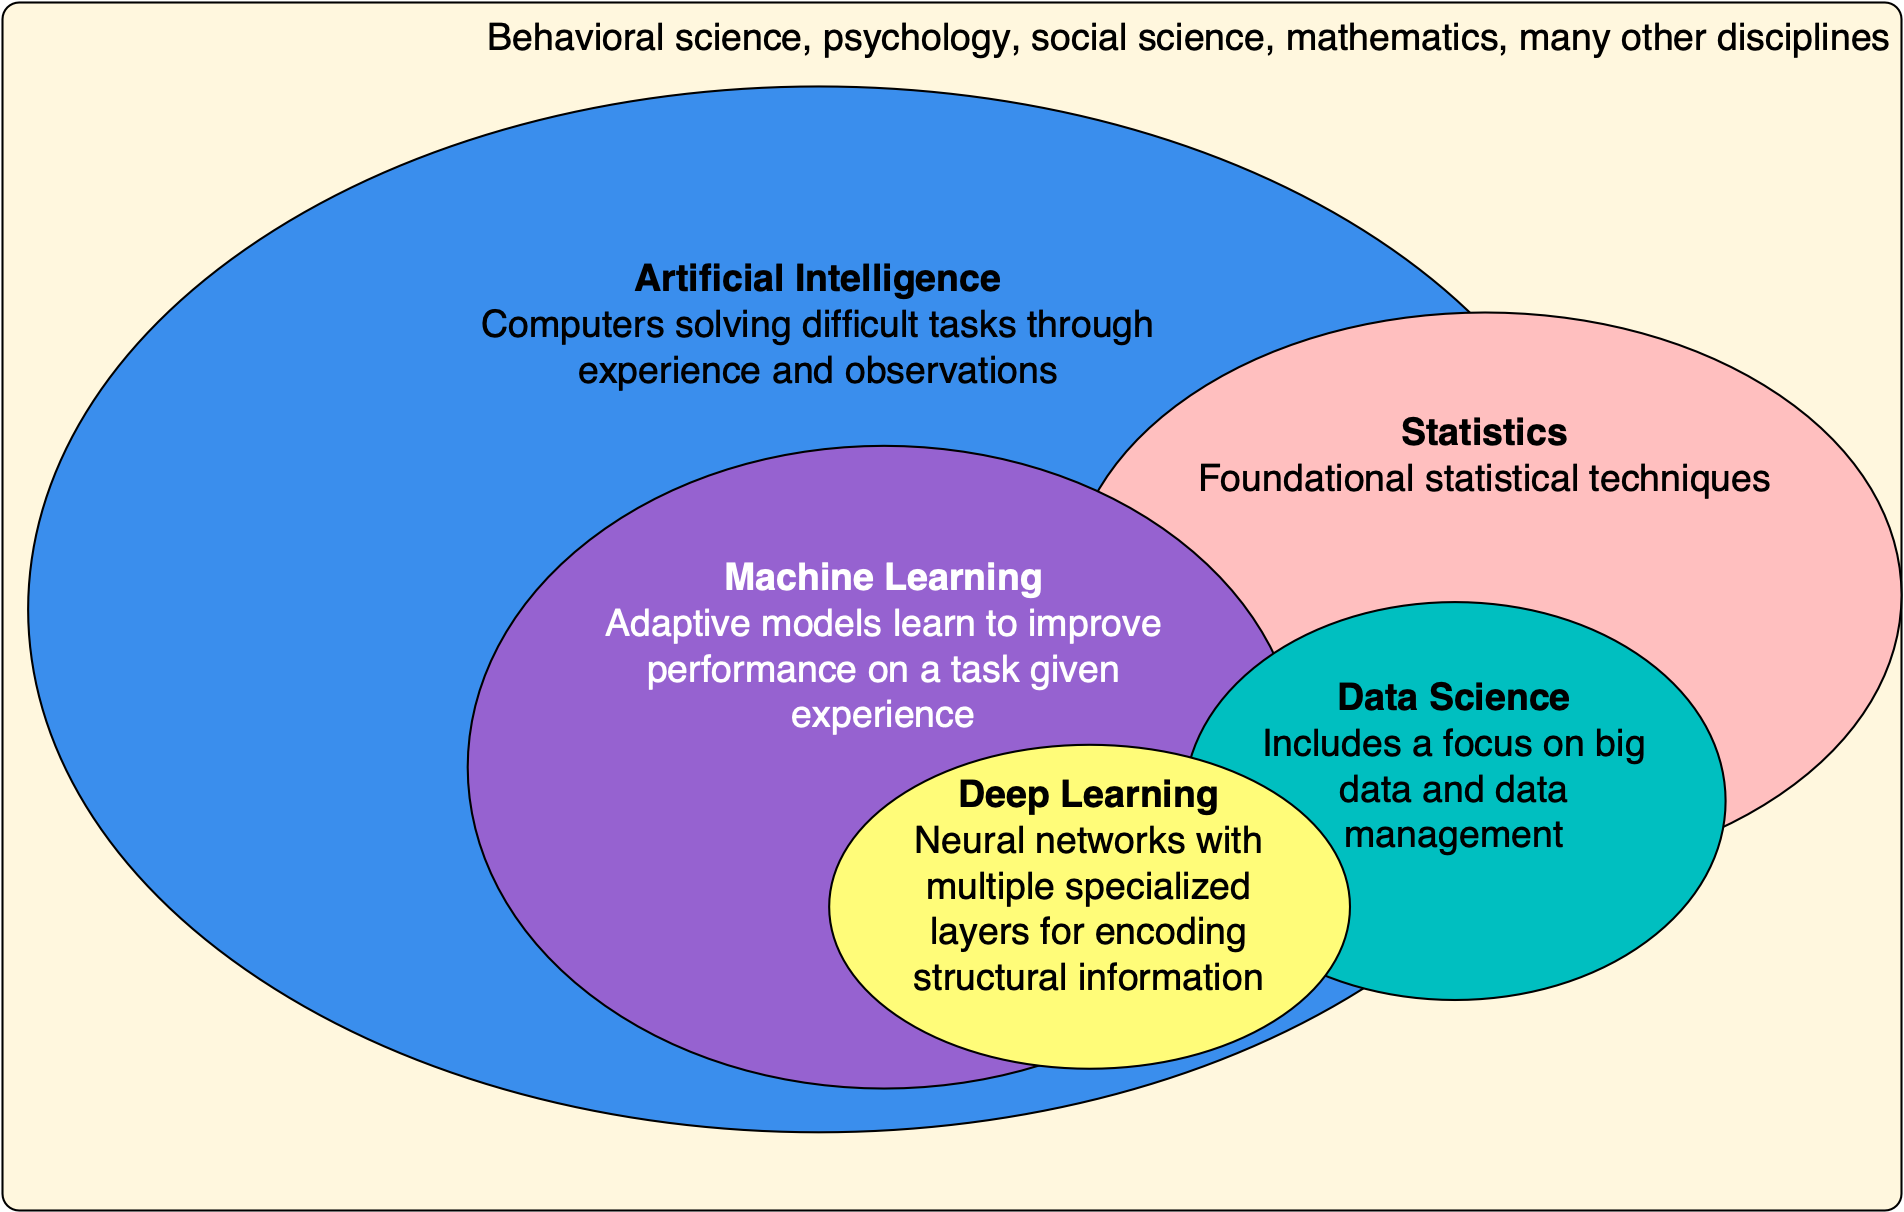 Figure 4A: Venn diagram showing relationships between AI, ML, and related fields. Source: AI Fall 2023 (ai-fall2023.ai2es.org) |
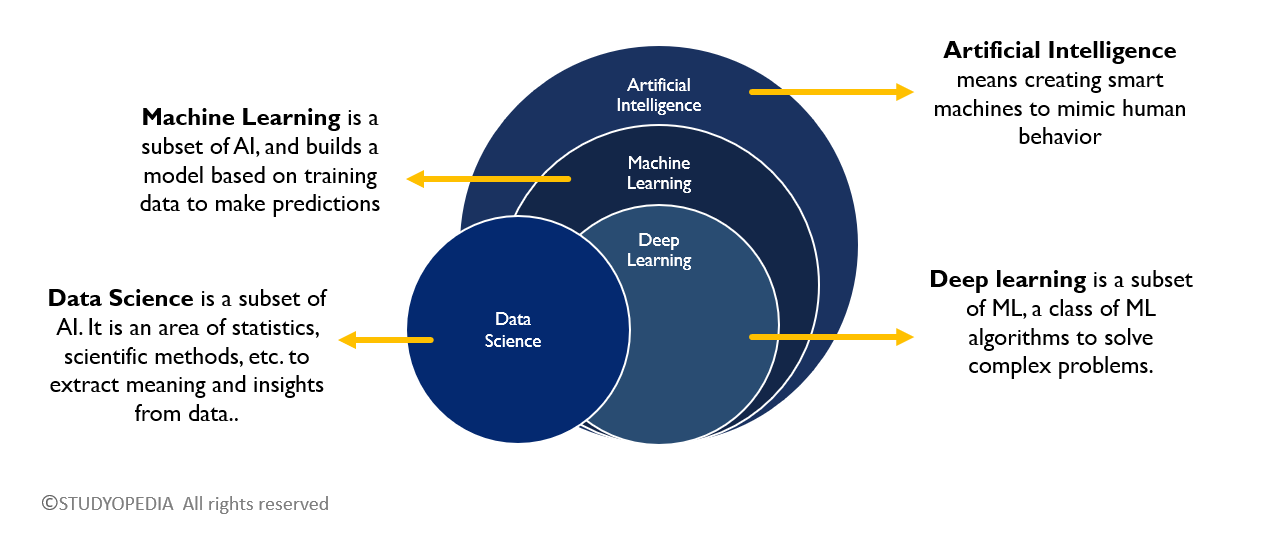 Figure 4B: Comparison of Data Science, ML, AI, and Deep Learning. Source: Studyopedia |
Brief History of Data Science#
Data science is a fairly new field. The term “data science” became popular in the early 2000s to describe a modern profession focused on using math, statistics, and computing to make sense of large and complex datasets, often called “big data.” Although data science feels like a modern invention, its roots stretch back much further than most people realize. At its core, the field grew out of two enduring human goals: to collect data and to make sense of it.

Figure 5: A high-level timeline of ideas that shaped the modern field of data science. Source: Adapted from Florian Huber, images of Bayes and Gauss from Wikipedia.
Early Foundations: Statistics Meets Computation (1900s–1950s)#
In the early 20th century, statistics emerged as a formal discipline, giving scientists tools for summarizing and analyzing data. The arrival of digital computers in the mid-1900s transformed these ideas: statistical methods could now be implemented at speed and at scale, laying the groundwork for computational approaches to data.
Data Analysis as a Scientific Activity (1960s)#
In the 1960s, the idea of treating data analysis itself as a scientific activity began to take shape. The statistician John Tukey argued that data analysis deserved a role alongside theory and mathematics as a way of extracting meaning from raw information.
Knowledge Discovery in Databases (1970s–1980s)#
As more data began to be stored electronically in the 1970s and 1980s, research communities focused on how to organize and learn from large datasets. This gave rise to KDD (Knowledge Discovery in Databases), which emphasized finding patterns and insights from stored data; an early precursor to modern data mining and machine learning.
The Phrase “Data Science” Appears (1974)#
Around the same time, in 1974, Peter Naur used the phrase data science to describe the emerging combination of computing and data analysis; notably before the term was widely adopted in industry or academia.
Data Mining Becomes a Discipline (1990s)#
By the 1990s, advances in databases, algorithms, and computing infrastructure pushed data analysis further, helping establish data mining as a research discipline with conferences, communities, and standardized practices.
The Modern Term Takes Shape (Early 2000s)#
In the early 2000s, the term data science began to spread more broadly. In 2001, William S. Cleveland proposed redefining statistics for the era of computing and large-scale data. Meanwhile, the internet, search engines, and digital storage were producing unprecedented quantities of information — early signals of what would soon be called big data.
Mainstream Adoption and Industry Growth (2010s)#
In the 2010s, data science entered mainstream awareness. Massive data streams from the web, mobile devices, sensors, and business systems demanded new methods to store, process, analyze, and model information. Organizations began adopting data science to improve decision-making, automate tasks, and gain competitive advantage.
The Big Data Era Changes Everything#
A major turning point came when technology companies such as Google, Amazon, Facebook, Netflix, and LinkedIn began collecting enormous amounts of behavioral data: clicks, searches, purchases, ratings, and social interactions. Traditional tools could not handle data at this scale, leading to new distributed systems such as Hadoop, MapReduce, and later Spark.
What Is Big Data?
“Big data” refers to data that is so large, fast, or complex that traditional tools cannot handle it easily. When people first started using the term, big data was explained with three V’s:
Volume — a very large amount of data
Velocity — how quickly data is created and needs to be processed
Variety — data in many different forms (text, images, logs, videos, etc.)
As more companies and researchers began working with big data, they noticed that size alone did not explain the full challenge. Later, two more V’s were added:
Veracity — refers to the quality of data that is being analyzed, as data may be messy, uncertain, or low quality.
Value — making sure the data is useful and worth analyzing .
These V’s help show not only what big data looks like, but also why it matters. In some discussions, additional V’s such as variability, visualization, and validity are also mentioned, although the five V’s remain the most commonly used definition.
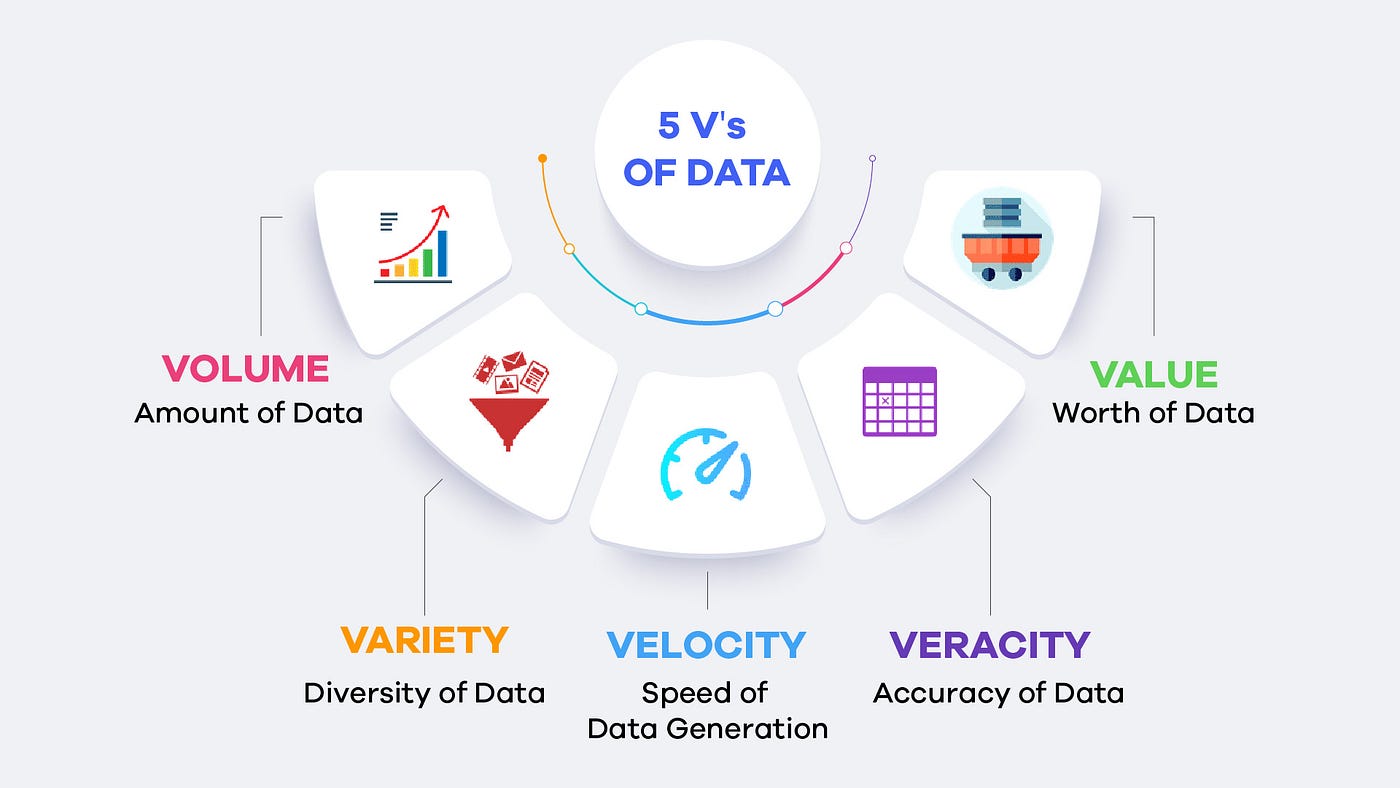 Figure 6-A. A Visual Depiction of the 5 V’s of Big Data. Source: miro.medium.com. |
 Figure 6-B. Growth of the Global Datasphere. Source: Forbes (Tom Coughlin). |
What made this period transformative was not just the size of the data, but how it was used. Companies learned to use data to recommend, rank, predict, and personalize services automatically. Data became a competitive advantage. As the value became clear, other industries, from finance and healthcare to transportation and retail, adopted similar strategies. By the late 2010s, data science had shifted from a niche specialty to a mainstream discipline practiced across many sectors.
Today, data science sits at the intersection of statistics, computational methods, and domain knowledge, supported by machine learning and deep learning. It continues to evolve as new tools reshape how we ask questions, what problems we can solve, and how data informs society.
Quick Timeline Summary#
Early 1900s — Formal statistical methods emerge
1960s — Tukey emphasizes data analysis as a scientific activity
1970s–1980s — Electronic storage + computing → large datasets
1990s — KDD and data mining research communities develop
Early 2000s — “Data science” becomes a formal term (Cleveland 2001)
2010s — Big data, industry adoption, and machine learning growth
Today — Data science integrates computation, ML/DL, and domain context