Descriptive Statistics: Understanding Data Before Modeling#
In data science, the temptation is strong to jump straight into modeling such as regression, classification, neural networks. But before we predict anything, we must understand what we already have. Descriptive statistics is the foundation of that understanding.
It answers a deceptively simple question:
What does this dataset look like?
Not through thousands of raw values, but through carefully designed summaries that capture structure, variability, and relationships. This chapter introduces the fundamental tools used to summarize data responsibly and intelligently.
Why Summary Statistics Exist?#
Imagine you are given a dataset with 50,000 salary records. You cannot stare at every number. You need structure. Descriptive statistics allow us to:
Summarize large datasets concisely
Identify patterns
Detect unusual behavior
Prepare for modeling
But here is the warning:
A summary statistic is not the dataset.
It is a compressed representation of the dataset. And compression always loses information. If you compute a mean without understanding the distribution, you risk misunderstanding the data entirely.
Same mean ≠ same distribution.
Four completely different datasets can have identical mean and variance, yet look nothing alike. That is why summary statistics come after visual and structural understanding, not before.
Case Study: The Fitness App Illusion#
You are working for a fitness startup. Your job is to summarize user daily step counts.You compute: Average daily steps = 9,800.
Marketing is thrilled. “Almost at 10,000! Users are active!”
But then you look deeper.
Here are the steps for 8 users (one of them is a marathon runner):
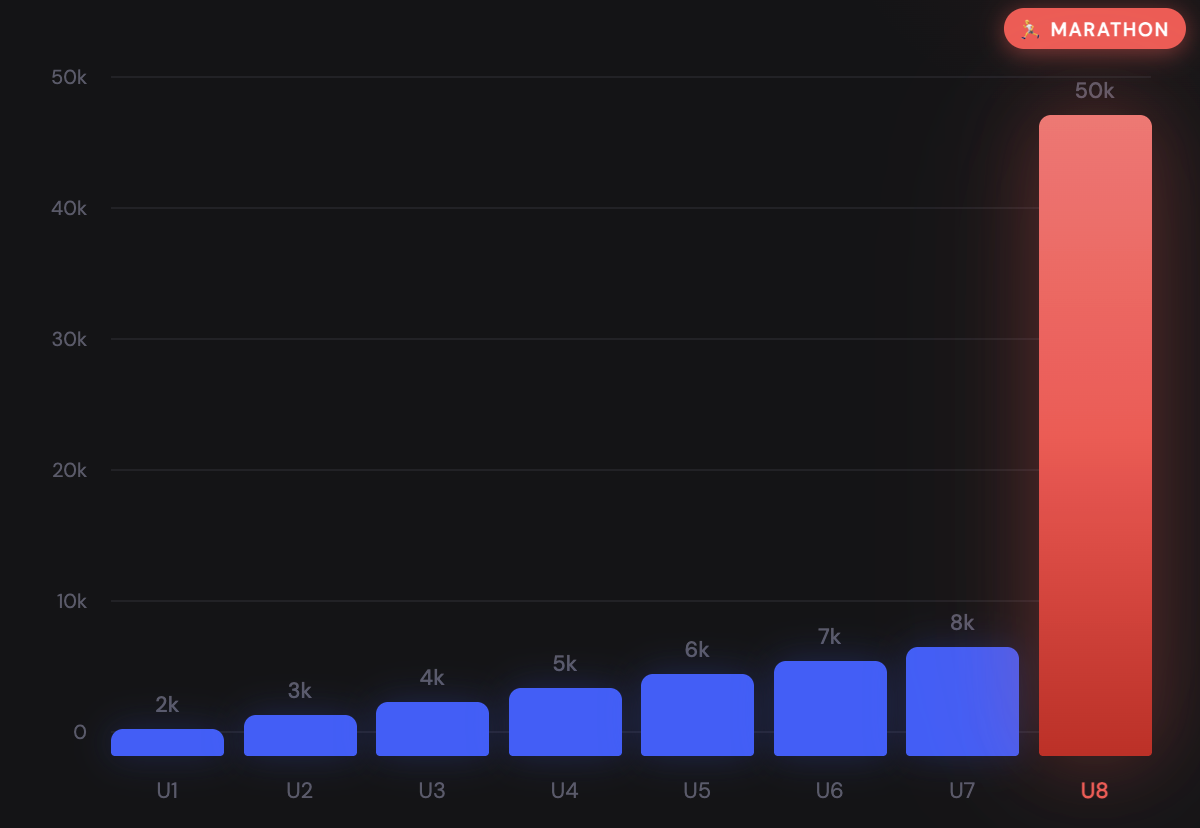
The mean says: “Users are very active.” The distribution says: “One extreme user is pulling the average.”
This is your first lesson:
A single number can hide structure.