(III) Measures of Variability: How Spread Out Is the Data?#
Knowing the center is not enough. Two datasets can have the same mean, but behave completely differently.
Variability measures how tightly or loosely data points cluster around the center.
(III.a) Variance#
Variance measures the average squared deviation from the mean.
Population Variance#
Sample Variance#
Why divide by \(n - 1\) instead of \(n\)? Because when estimating from a sample, we correct for bias. This is called Bessel’s correction.
Why Squared Deviations?#
We square differences because:
Positive and negative deviations would cancel out otherwise
Squaring gives more weight to larger deviations
It aligns with optimization methods used in statistical modeling
But variance has a problem: Its units are squared (example: if data is in dollars, variance is in dollars²). This makes it difficult to interpret directly.
(III.b) Standard Deviation#
The standard deviation solves this problem by taking the square root of variance.
Now the units match the original data. This makes it easier to interpret.
Interpretation#
Small standard deviation → Data points are tightly clustered around the mean
Large standard deviation → Data points are widely spread out
Standard deviation tells us how much variability exists in the dataset.
Example: Same Mean, Different Spread#
Dataset A: 50, 51, 49, 50, 50
Dataset B: 10, 90, 30, 70, 50
Both datasets have the same mean (50), but their variability is very different.
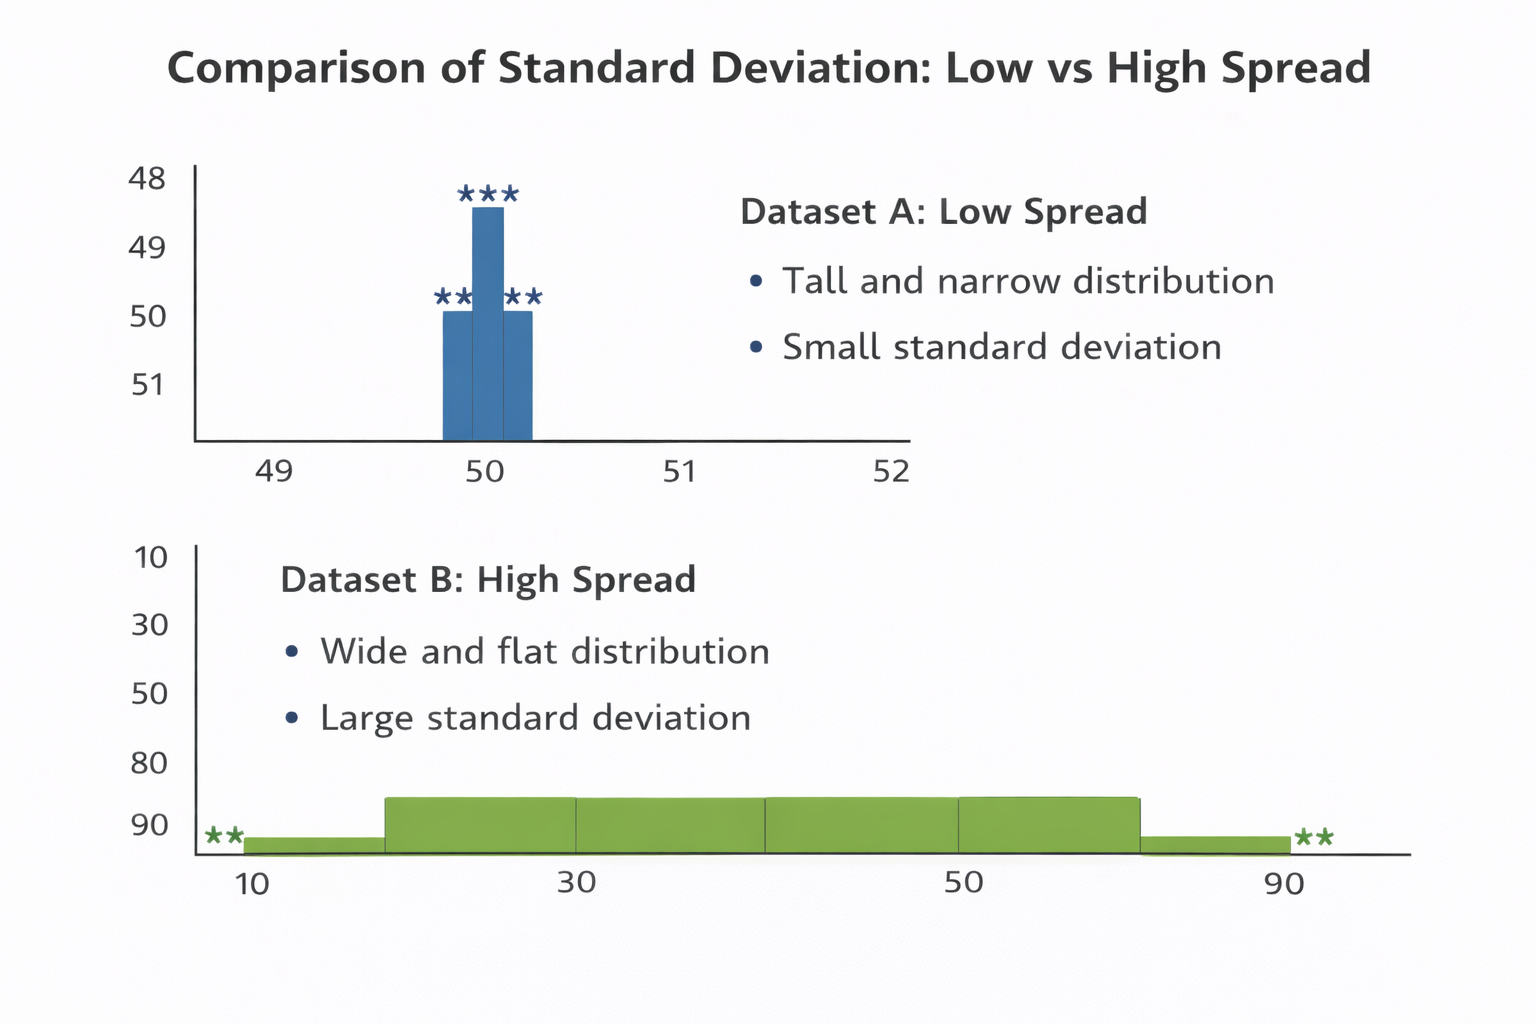
Figure: Dataset A is tightly clustered (small standard deviation), while Dataset B is widely spread out (large standard deviation).
Same average does not mean the data behaves the same — spread matters.