Methods for Collecting Data#
There are different ways to collect data.
1. Observational Study#
In observational studies, researchers do not assign treatments or interventions. They simply observe what already happens in the real world. Because there is no random assignment, it is harder to establish causality and confounding is a major concern.
Observational Data vs. Experimental Data
In practice, much of data science relies on observational data: logs, surveys, transactions, or passively collected information. Observational data can reveal correlations, but often struggles with causal inference due to confounding factors.
Experiments, by contrast, are actively designed to create credible comparisons and reduce confounding.
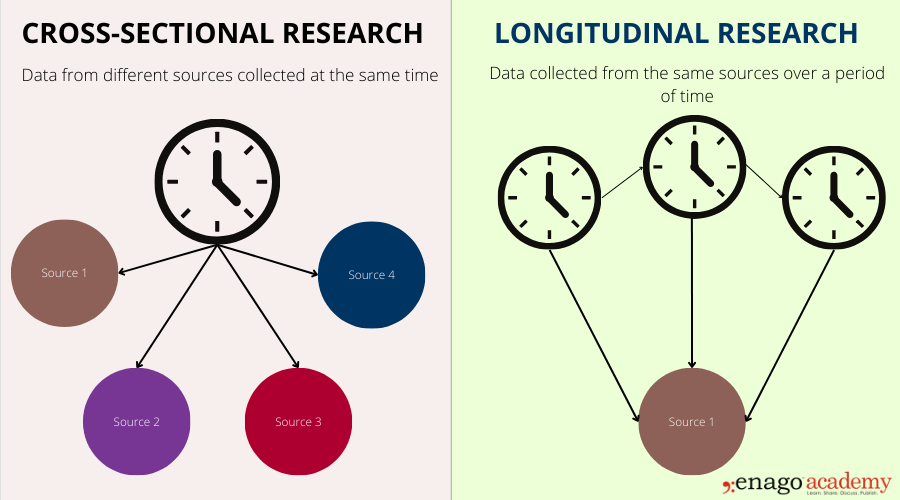
There are three common types of observational studies:

|

|
Figure 10. Three common types of observational studie. Source: amazonaws.com
(a) Cross-Sectional Studies:#
A cross-sectional study collects data at one single point in time; like taking a snapshot of a population. It does not follow people over time and does not look backward in time.
Goal: usually to describe what is happening right now or to look for associations between variables, not to establish cause and effect.
It’s like taking a picture of a classroom today and measuring everyone’s height and weight once.
(b) Retrospective/Historical (Case-Control) Studies:#
Retrospective studies start with an outcome that has already happened and look backward in time to find possible causes.
Example: Compare people with lung cancer (cases) and people without it (controls) and ask about their past smoking habits.
Retrospective studies are useful for rare outcomes, but people may not remember the past accurately.
(c) Prospective (Longitudinal / Cohort) Studies:#
Prospective studies follow a group of people (a cohort) forward in time to see how different characteristics or exposures lead to different outcomes.
Example: Follow a cohort of smokers and non-smokers for several years to see who develops lung cancer.
Prospective studies provide stronger evidence for cause-and-effect, but they take longer and can be expensive.
2. Survey#
A survey is a common way to collect information by asking people questions. Surveys can be done in many formats, online, by phone, by email, or in person and are often used to learn about opinions, behaviors, attitudes, or characteristics of a population.
Surveys are usually observational because researchers do not assign treatments or change anything; they simply gather responses.
Surveys can be descriptive (e.g., estimating how many students drink coffee) or can look for associations (e.g., relating coffee consumption to sleep), but they cannot easily establish cause and effect.
 Figure. Survey data collection. |
Surveys are flexible, inexpensive, and can reach large groups quickly, making them widely used in social science, marketing, political polling, and public health. |
Good surveys depend on well-designed questions. Poorly worded or confusing questions can introduce bias, influence responses, or produce misleading results. Clear, neutral, and specific questions help improve the quality and reliability of survey data.
3. Simulation#
Sometimes it is difficult, slow, expensive, or even impossible to run a real experiment in the world. In those cases, we can use a simulation.
A simulation is a computer-based experiment where we create a simple model of the real world and let the computer generate many possible outcomes. Instead of collecting data from people or running a physical experiment, we let the computer “pretend” the experiment happens many times.
In short: simulation is like a virtual experiment.
Why use simulation? Real experiments may be too costly, too risky and may be too slow.
Example#
A company might simulate customer arrivals and service times to study how long people wait in line.
In data science, we might simulate many random samples to understand how a statistic (like the mean) behaves; this is often called a Monte Carlo simulation.
Simulation does not replace real data, but it is a powerful tool for exploring behavior, testing designs, and building intuition when running real experiments is difficult.
The Invisible Enemy: Confounders#
Experiments would be simple if the world contained only two variables: one we change and one we measure. In reality, almost every outcome is influenced by many factors we do not control.
These extra influences are called confounders, hidden variables that affect the outcome but are not part of the intended treatment.
What is a Confounder?
A confounder is an outside factor that makes it harder to tell whether the treatment actually caused the change we observe.
A confounder typically:
affects the independent variable (treatment), and
affects the dependent variable (outcome), and
creates the appearance that X causes Y when something else is influencing both
In short, confounders can create a misleading or “fake” relationship between the variables we care about.
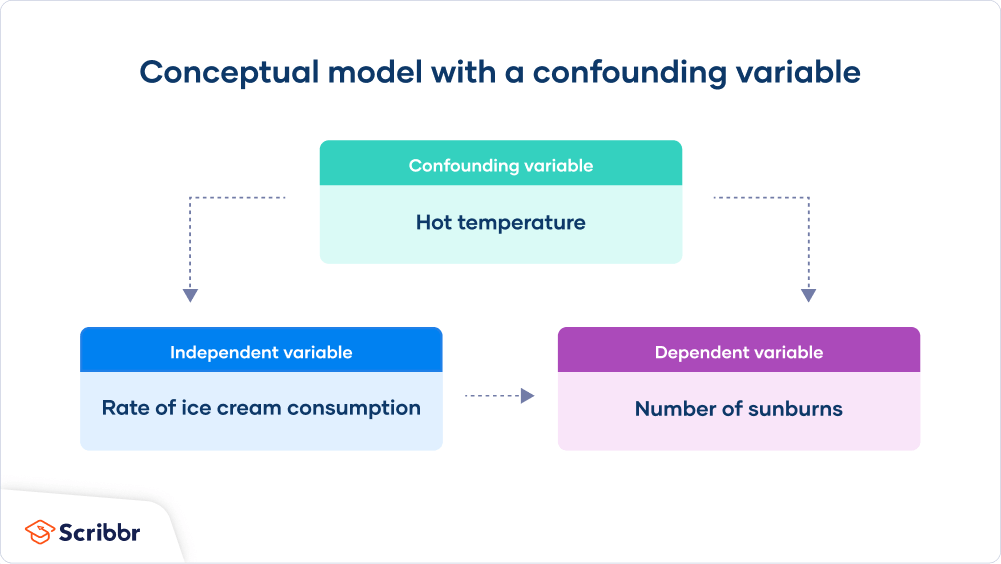
Figure 4. The confounding variable (hot temperature) affects both the independent variable (ice cream consumption) and the dependent variable (sunburns), which can create a misleading relationship if not controlled for. Source: Scribbr article.
For example:
Comparing two school tutoring programs without considering family income may lead to misleading conclusions.
Online, testing a new website layout without considering device type (mobile vs desktop) may distort click-through rates (CTR).
Confounders are dangerous because they can make ineffective treatments look effective or vice versa. Much of experimental design exists to keep them under control.
Strategies for Controlling Confounders#
Good experimental design addresses confounding before data is collected, and good analysis techniques help address it after data collection.
Broadly, strategies fall into two stages:
Design Stage (Before Data Collection)#
This is the planning stage; the experiment hasn’t been run yet. Decisions made here affect how data is collected. The best time to handle confounders is early, during this planning of the experiment.
1. Randomization
Randomization just means we randomly put people (or units) into different groups. Why random? Because if we don’t, the groups might be unfair from the start.
Randomly assigning participants to treatment groups helps ensure that confounders (both known and unknown) are evenly distributed across groups.This reduces systematic differences and strengthens causal interpretation.
Now if the two groups behave differently, we can be more confident the treatment caused it, not some hidden factor in the background.
We can apply randomization in different ways. For example:
(a) Random Sampling:
We put individuals into groups purely at random, without considering characteristics like age, device type, or prior behavior.
Example: Randomly assigning students to two study methods helps balance motivation, prior knowledge, and study habits across groups.
Key idea: Random Sampling balances confounders on average.
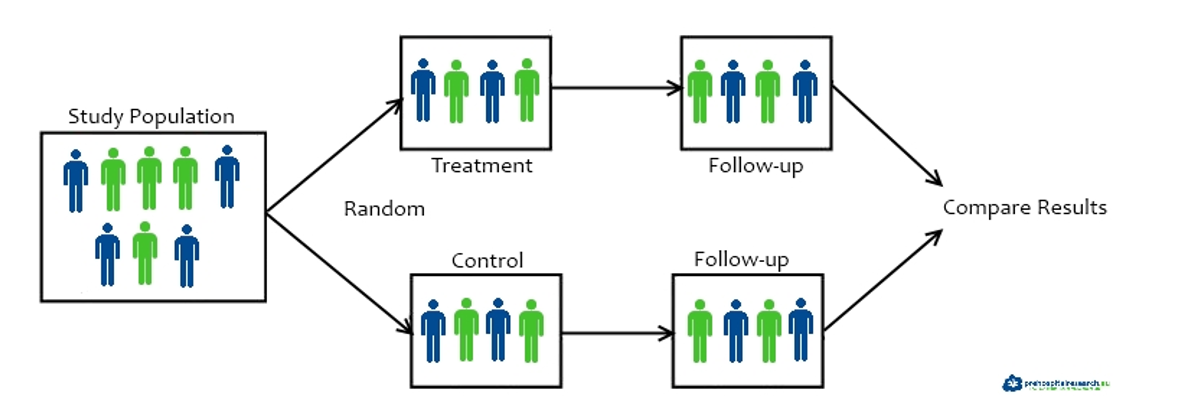
Figure 5A. A randomized experimental design showing how a study population is split into treatment and control groups, followed over time, and then compared. Source: Fiveable exp. design visual diagram.
Sometimes randomization alone is not enough, especially when important subgroups behave differently. In those cases, we can use stratified randomization.
(b) Stratified Randomization:
We first group (stratify) people based on an important characteristic, then randomly assign within each group. We stratify when certain characteristics matter, such as: age, gender, device type, customer type (new vs returning), performance level, income bracket, etc.
Example: Before randomizing, users are split into “mobile” and “desktop” strata. Within each stratum, users are randomly assigned to version A or B. This ensures the comparison isn’t distorted if mobile users behave differently than desktop users.
Key idea: Stratified Randomization balances confounders within subgroups, not just on average.

Figure 5B. Full population being split into strata first, then randomized within each subgroup. Source: Benchmark Six Sigma forum.
In general, randomization helps make the groups similar on average so that differences in outcomes are more likely due to the treatment and not some hidden factor.
2. Restriction
Restriction means we limit who or what we include in the experiment so the groups are more similar to begin with.
Restriction reduces confounding by limiting the experiment to a more comparable subgroup, so it cannot vary. Remember, you only study one subgroup, everyone outside that subgroup is excluded. Examples:
Example: If we’re testing a new rehab treatment, we might only include patients aged 40–60 instead of everyone from 10 to 90. This avoids age becoming a distracting factor.
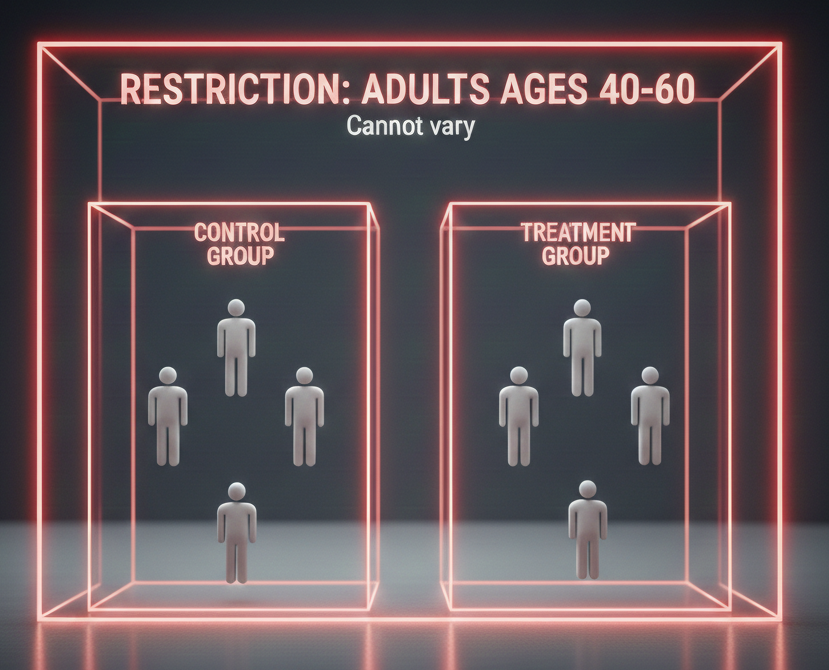
Figure 6. With restriction, we only include adults ages 40–60 in the experiment.
Age cannot vary anymore.
Restriction reduces confounders by removing variation in that characteristic. By restricting who is included, we reduce variation and make it easier to compare outcomes fairly.
3. Matching / Blocking
Matching: reduces confounding by pairing or grouping units that share important characteristics before assigning treatments.
We keep participants with different characteristics, but we pair or group them so that the treatment and control groups are similar.
Units can be matched on age, income, or baseline performance.
One member of each pair receives the treatment, and the other receives the control.
This makes comparisons more fair because each treated unit has a similar “partner” in the control group.
Key Idea: Unlike restriction, matching does not remove variation; it balances it across groups.
Example:
Pairing 45-year-old participants with other 45-year-olds before random assignment.
If two students have similar grades and similar study habits, we can match them, one gets Method A, the other gets Method B. Now the comparison is cleaner, because we controlled for those similarities.
Blocking: When matching is done in groups rather than pairs, the approach is often called blocking.
Key Idea: Group subjects into blocks based on a potential confounder. Then randomize within each block
Example we might block by age group (e.g., 18–25, 26–35, 36–45) and then randomize treatment vs control within each block so age doesn’t skew the results.
(a) Block Design (Matched Pair):
A matched-pair design is a special case of a randomized block design where each block contains two similar participants. The key idea is to compare like with like.
Participants are first paired based on a confounding characteristic such as prior knowledge, and then randomly assigned to treatment or control within each pair.
One member of the pair serves as the control (normal study time) and the other as the treatment (increased study time).
Because both students start with similar baseline ability, differences in exam scores are more likely due to study time rather than pre-existing differences.
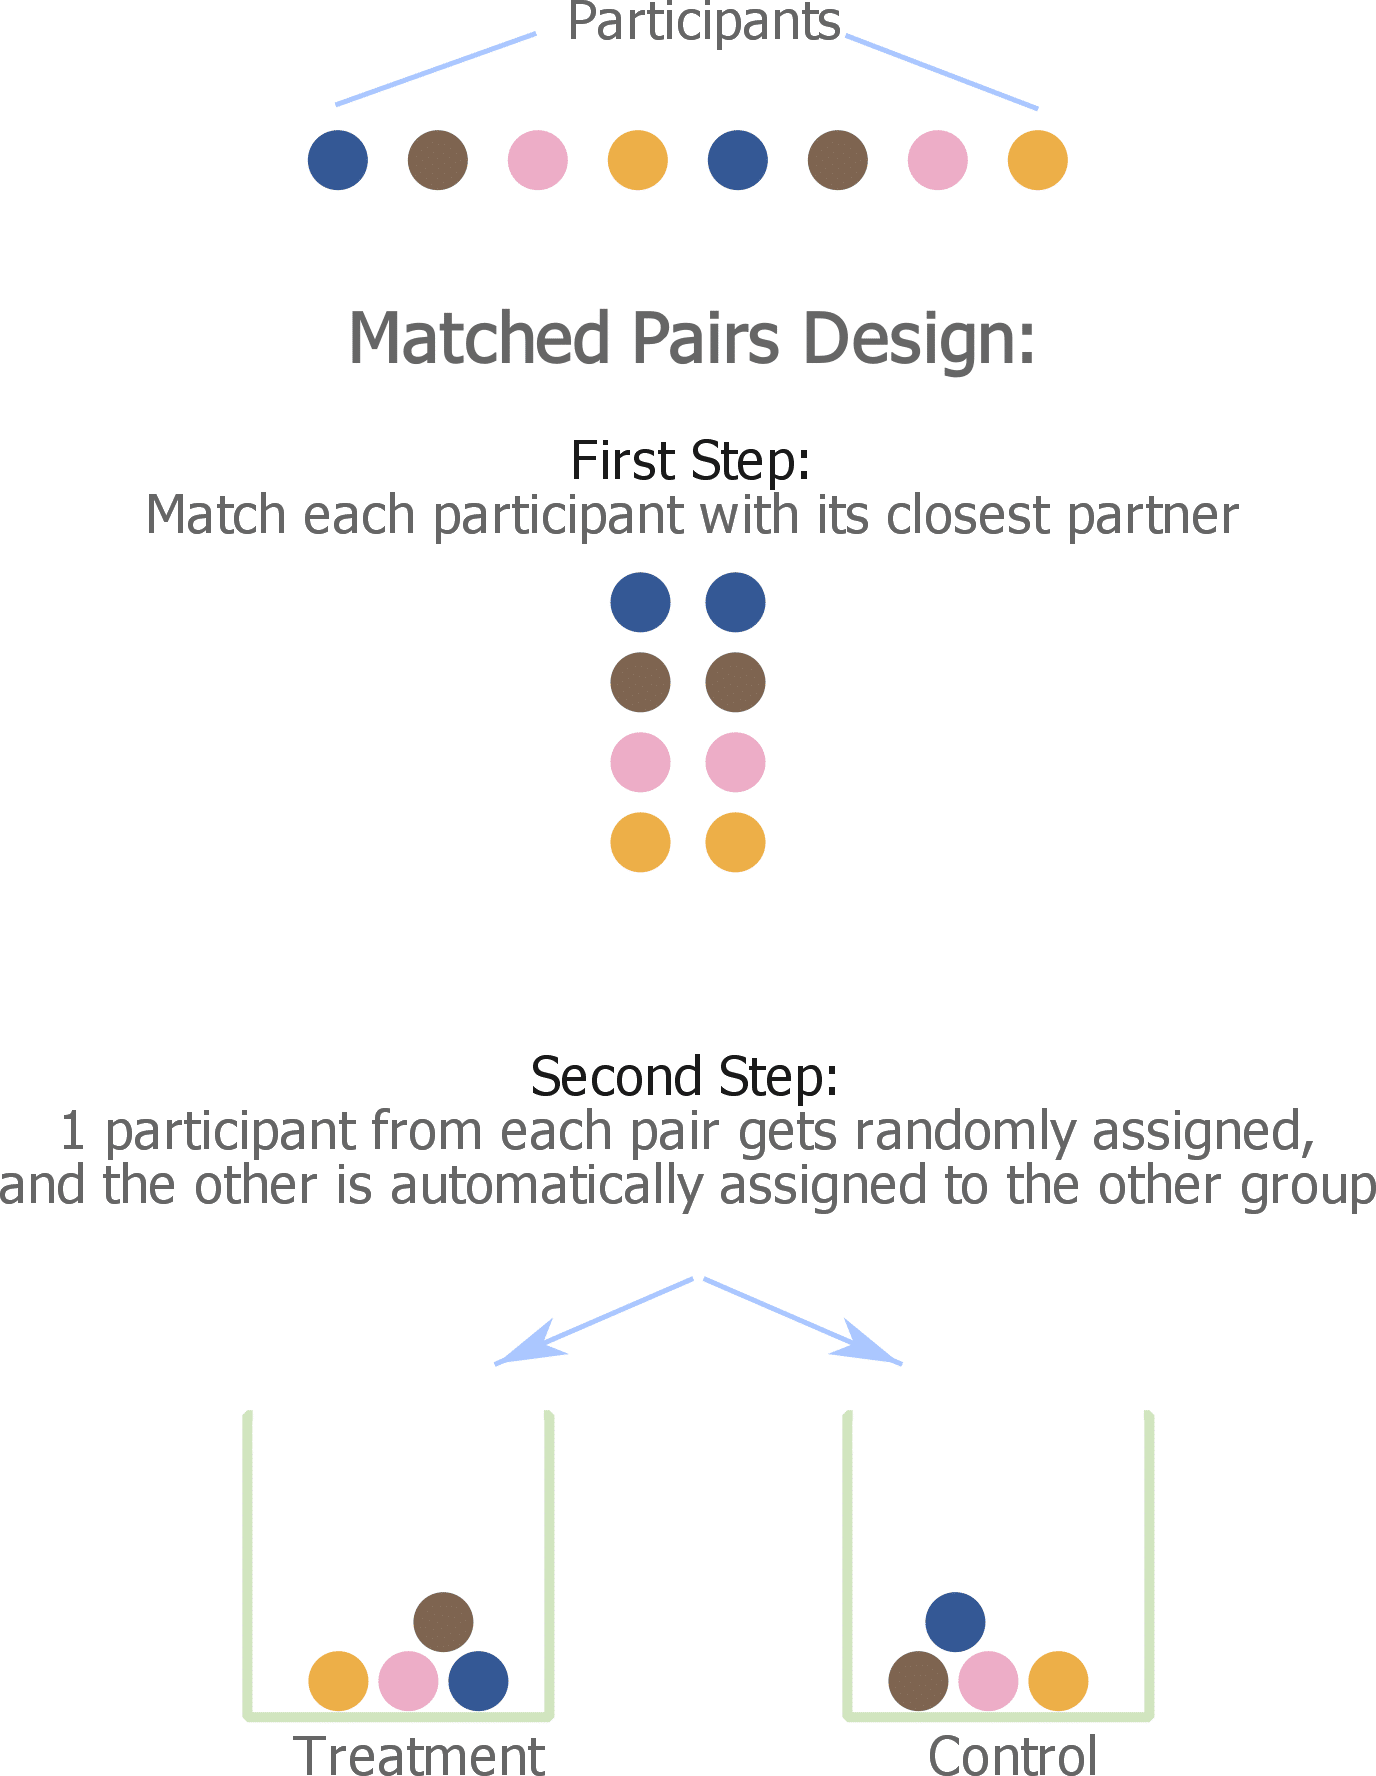
Figure 7. Matched-pair block design. Participants are matched on a key characteristic (e.g., prior knowledge) and then randomly assigned within pairs. Source: Quantifying Health
The matched-pair design controls the confounder within each pair, making the comparison more fair.
Analysis Stage (After Data Collection)#
If confounders were not fully handled during design, they can still be addressed at the analysis stage using statistical techniques. This stage happens after the experiment (or observational study) has produced data.
Replication#
Replication means repeating the experiment across different samples, time periods, or settings.
A company could rerun an A/B test in week 2 after seeing results in week 1.
A researcher could reanalyze the data using different subsets or models.
Replication checks whether a result is reliable or just a fluke. It does not remove confounders by itself, but it reveals whether a finding holds up under repeated testing.
Key Summary:
No single strategy removes confounders completely; but combining approaches strengthens the experiment and increases confidence in the conclusions.