(IV) Correlation and Relationships Between Variables#
So far we’ve described one variable at a time.
Now we ask:
How do two variables move together?
(IV.a) Correlation#
Correlation measures the strength and direction of a linear relationship between two variables. The most common measure is Pearson’s correlation coefficient (r).
\[
-1 \leq r \leq 1
\]
Interpretation of r#
r Value |
Meaning |
|---|---|
r ≈ 1 |
Strong positive linear relationship |
r ≈ -1 |
Strong negative linear relationship |
r ≈ 0 |
No linear relationship |
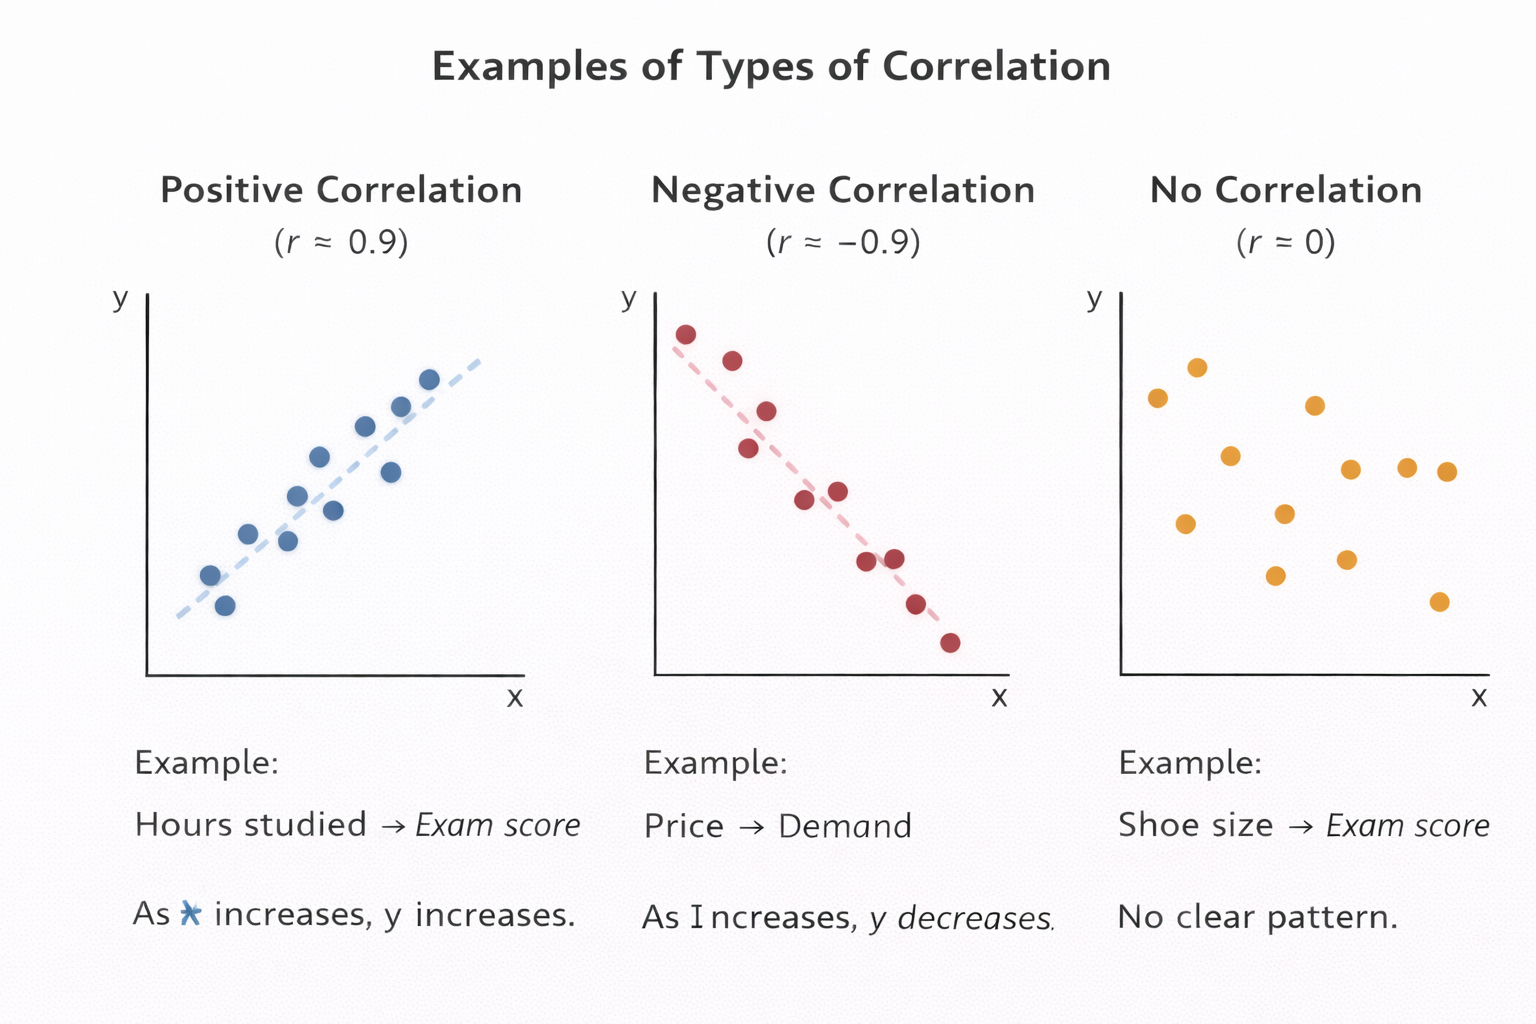
Figure: Scatter plot examples showing positive, negative, and no correlation between two variables.
Positive: As x increases, y increases (e.g., study time and exam score)
Negative: As x increases, y decreases (e.g., price and demand)
None: No clear relationship (e.g., shoe size and exam score)