Example Walkthrough#
Let’s return to the food delivery company.
Data:
Old system mean = 24.10
New system mean = 25.30
Sample size = 200 users
Sample standard deviation = 5
We run a t-test. Suppose we get: p-value = 0.02
Interpretation: If the new system had no effect, there is only a 2% chance of seeing this difference.
That is small. So we reject the null hypothesis.
Conclusion: Evidence suggests the new recommendation system increases order value.
What Hypothesis Testing Does NOT Tell You#
Very important. Rejecting the null does NOT prove something is true with certainty. It only means:
The data is unlikely under the null assumption.
Also:
Small p-value ≠ large impact
Statistical significance ≠ practical importance
A tiny improvement can still be statistically significant if sample size is huge.
Always check effect size too.
Two Common Mistakes (Errors)#
Because decisions are made under uncertainty, mistakes can happen.
Type I Error: False Alarm#
Rejecting a true null.
Example: We think the new system works… but it doesn’t.
Probability = α (e.g., 5%)
Type II Error: Missed Detection#
Failing to reject a false null. Example: The system really works… but we fail to detect it.
Visualizing Type I and Type II Errors#
Understanding statistical errors becomes much easier when we see them visually. The graph below shows two distributions:
The null hypothesis distribution
The alternative hypothesis distribution
Because these two distributions overlap, mistakes are possible.
Type I error (α) — rejecting a true null hypothesis (false positive)
Type II error (β) — failing to reject a false null hypothesis (false negative)
The shaded regions in the figure show where these errors occur.Everything else represents correct decisions.
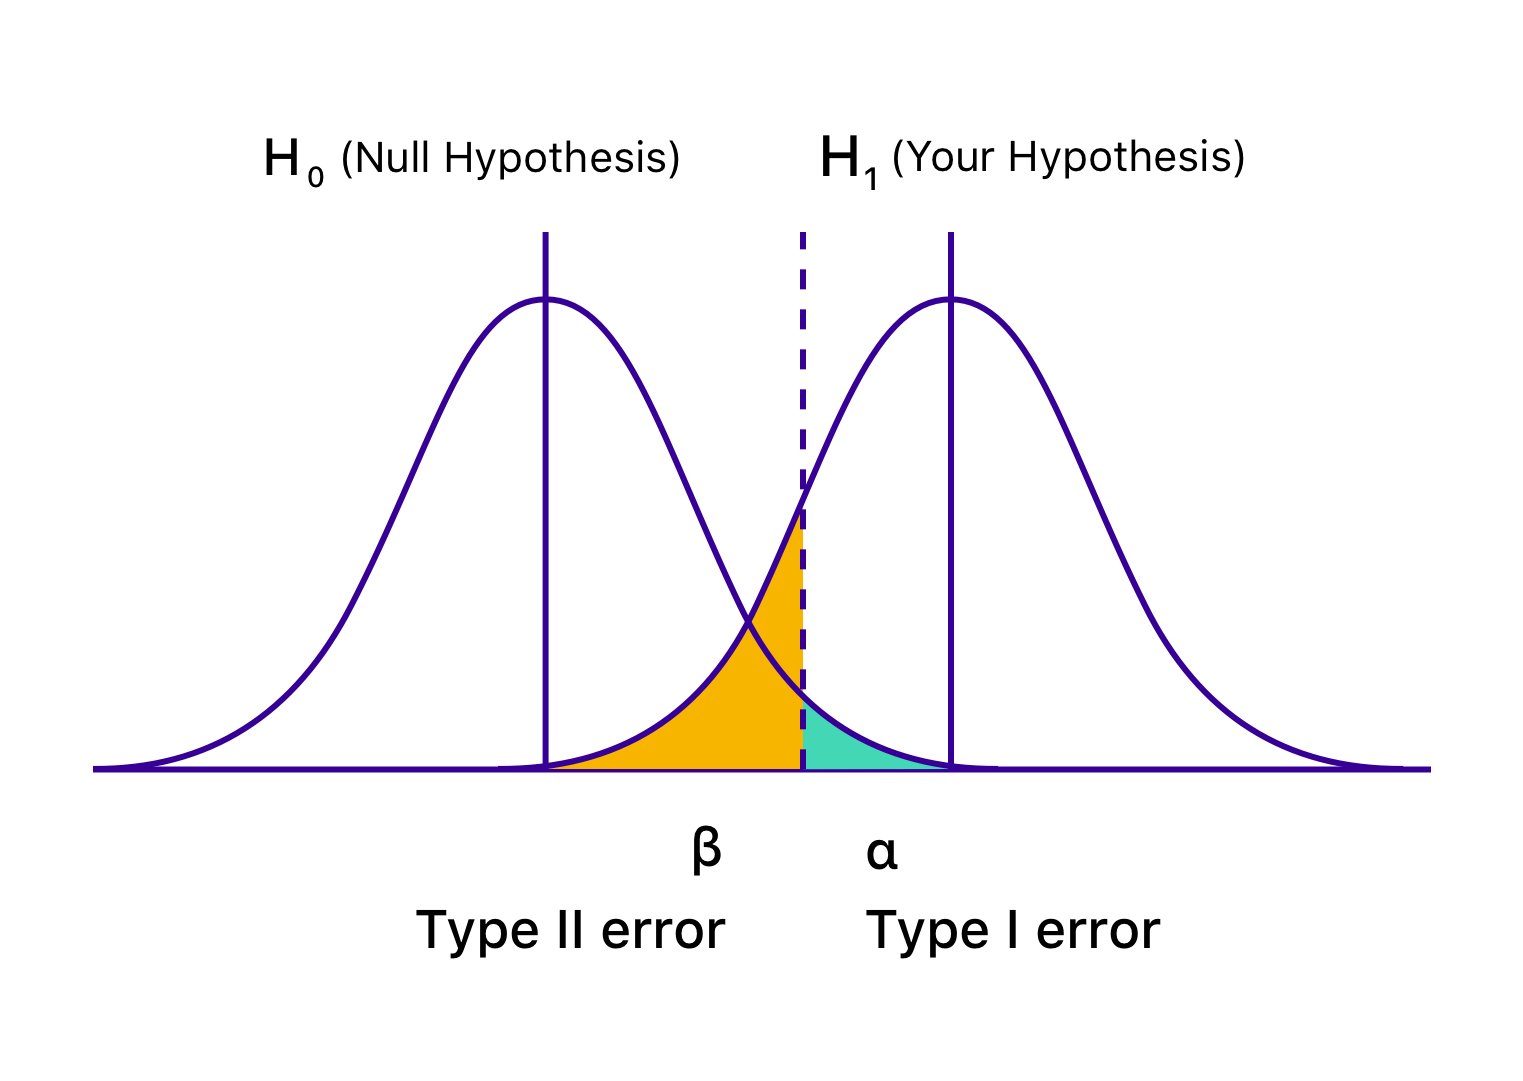
Figure: Graphical representation of hypothesis testing errors.The blue curve shows the distribution when the null hypothesis (H₀) is true, and the green curve shows the distribution when the alternative hypothesis (H₁) is true. The vertical line indicates the critical value. The shaded area under H₀ beyond this boundary represents the Type I error (α), while the shaded area under H₁ on the non-rejection side represents the Type II error (β).
Source: Wingify (VWO).
Why This Matters in Data Science#
Hypothesis testing appears everywhere:
A/B testing products
Evaluating ML model improvements
Medical research
Marketing campaigns
Feature impact analysis
Policy evaluation
Any time we ask:
Did this change actually cause an effect?
We use hypothesis testing.
Final Business Interpretation: We answer three questions:
Is the difference statistically real?
How large is the difference?
Is it worth implementing?
Data science is not just testing: it is decision making.
In the next section, we will implement a t-test in Python and run a real A/B experiment.