Introduction to “Regression”#
Regression is one of the most fundamental techniques in data analysis and machine learning. At its core, regression is about understanding relationships between variables and using those relationships to make predictions.
In many real-world problems, we are not just interested in classification (yes/no), but in predicting a continuous value. For example:
What will be the price of a house given its size?
How will sales change with advertising budget?
What temperature can we expect tomorrow?
These types of problems naturally lead to regression models.
In regression, we typically define:
Dependent variable (target): the value we want to predict
Independent variables (features): the inputs used to make predictions
A More Intuitive Way to Think About Regression#
Before jumping into formulas, it helps to think about regression in a more natural way.
Imagine you are looking at data points plotted on a graph; perhaps house sizes on the x-axis and prices on the y-axis. The points are scattered, but you can visually sense a trend: larger houses tend to cost more.
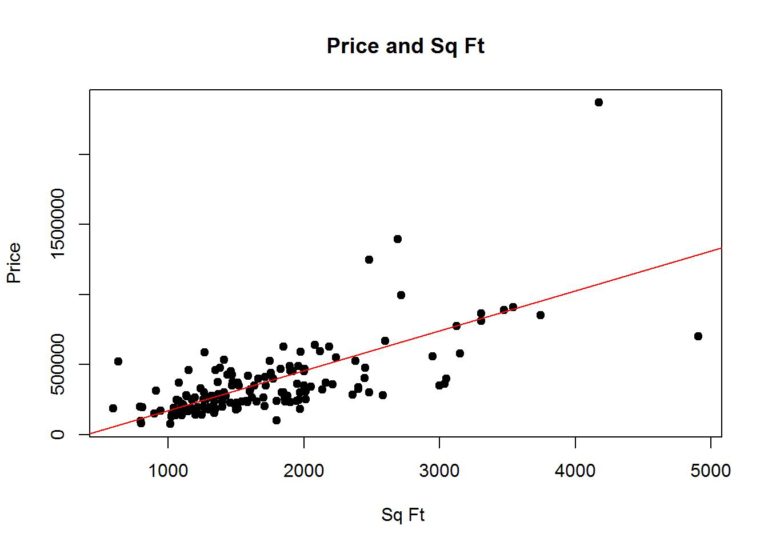
Regression is essentially the process of drawing a line (or curve) that best captures this trend. t is not about perfectly matching every single point. Instead, it is about capturing the overall pattern so that we can:
Understand how variables are related
Make reasonable predictions for new, unseen data
In that sense, regression is both:
A predictive tool, and
An explanatory tool
Another Perspective: Best Fit Line#
Another way to think about regression is through the idea of a best fit line.
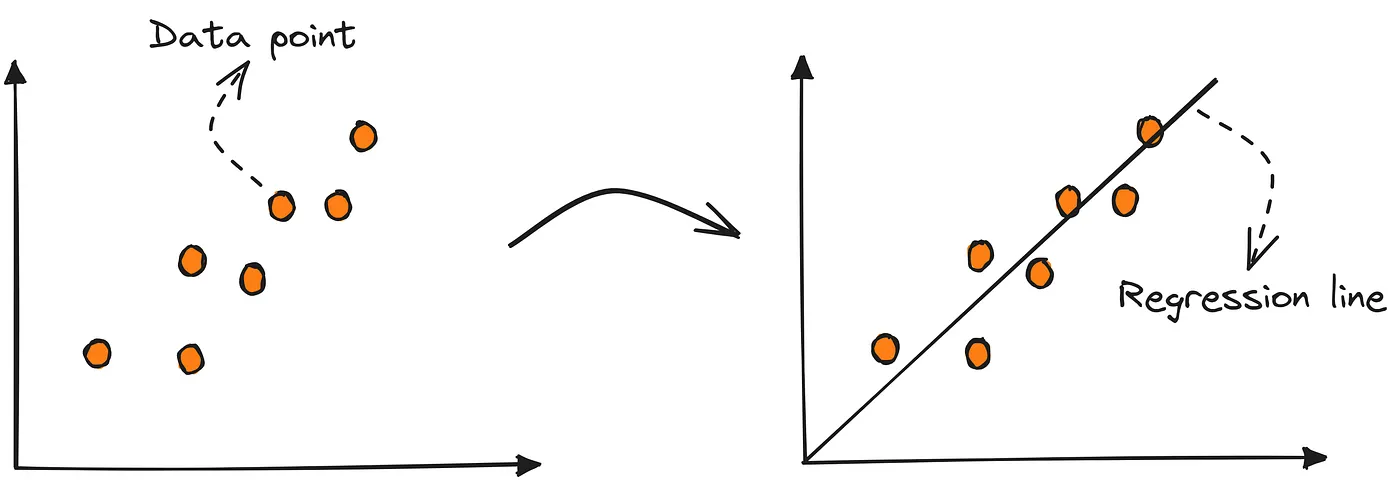
Illustration of How Linear Regression Models Relationships Using a Straight Line. Source:Dede,Medium.com
Here, the goal is to draw a line that minimizes the overall error between actual data points and predicted values. This line may not pass through every point, but it balances all of them in the best possible way.
Goal of Regression: Best-Fit Line#
The goal is to find the best-fit line.
The central goal of regression is to find a function that best represents the relationship between input variables (features) and the target variable. In linear regression, this function takes the form of a straight line.
But what does “best” actually mean?
The best-fit line is the line that most closely follows the overall pattern in the data. It does not try to pass through every data point. Instead, it balances all points by minimizing the overall prediction error.
A good regression line should:
Fit the data well without overreacting to noise
Minimize prediction errors across all data points
Capture the underlying relationship between variables
This is an important shift in thinking:
We are not trying to eliminate error completely, we are trying to minimize it in a principled way.
Visual Intuition#
If you imagine multiple possible lines passing through the same dataset:
Some lines will be too steep
Some will be too flat
Some will miss most points

Linear Regression Fit |

Residual Visualization |
Left: Best-fit regression line capturing the overall trend. Right: Residuals showing the difference between actual and predicted values.
The best-fit line is the one that balances all deviations (errors) in the most optimal way.
Comparing Different Fits#
Not all lines fit the data equally well. Some lines capture the trend better, while others produce large errors.

Different lines produce different total errors. The best-fit line is the one that minimizes the overall residual error.
From above diagram notice that, each line produces a different total error:
Blue line → smallest error → best fit
Green line → moderate error
Red line → very large error → poor fit
This motivates why we need a formal way (cost function) to measure error. This is exactly what leads us to concepts of Residuals, Loss function and Cost function (MSE) (we will cover later in this chapter).
Why Regression Matters#
Regression appears everywhere, often in ways we do not immediately notice:
In economics, to understand how income affects spending
In healthcare, to study how dosage impacts recovery
In business, to forecast future demand
In social sciences, to analyze relationships between variables
What makes regression powerful is that it provides quantitative insight. It does not just say “these are related” — it tells us how strongly they are related and in what direction.