The Story of Exploration#
Before building predictive models, before testing hypotheses, and before drawing conclusions, a data scientist must first learn to observe.
This stage of careful observation is known as Exploratory Data Analysis (EDA) ; the process of examining data in its raw form to understand its characteristics, behavior, and limitations before formal modeling begins.
Real-world data rarely arrives clean, structured, or fully explained. Often, we begin with nothing more than rows and columns without context. EDA provides a systematic way to make sense of this uncertainty. It transforms unfamiliar data into interpretable information.
Exploration is not about proving something to be true. It is about becoming familiar with what the data contains and what it might reveal.
What is Exploratory Data Analysis (EDA)?#
When you first open a dataset, all you see is a table of numbers and labels. There is no guide, no explanation; just rows and columns. Exploratory Data Analysis (EDA) is the structured process of making sense of that raw data.
Exploratory Data Analysis (EDA) is the process of understanding data; its structure, quality, patterns, and surprises.
EDA helps us:
Discover patterns
Detect anomalies
Understand structure
Test assumptions
Generate hypotheses
Before building models or drawing conclusions, we must first listen to the data.
EDA is not a single step; it is an iterative cycle:
Ask questions
Explore the data
Refine the questions
Repeat
The EDA Checklist: A Structured Exploration Framework#
While EDA encourages open investigation, it should not be random. A practical checklist ensures that exploration remains systematic, thorough, and reproducible. A structured EDA process typically includes:
Define the objective
Understand data structure and types
Assess data quality
Explore distributions and variation
Examine relationships between variables
Transform data when needed
Summarize insights and limitations
The EDA Workflow#
The EDA workflow illustrates how analysis moves from initial inspection to deeper understanding through
EDA is not random inspection. It is a structured investigation that moves from data inspection to insight generation.
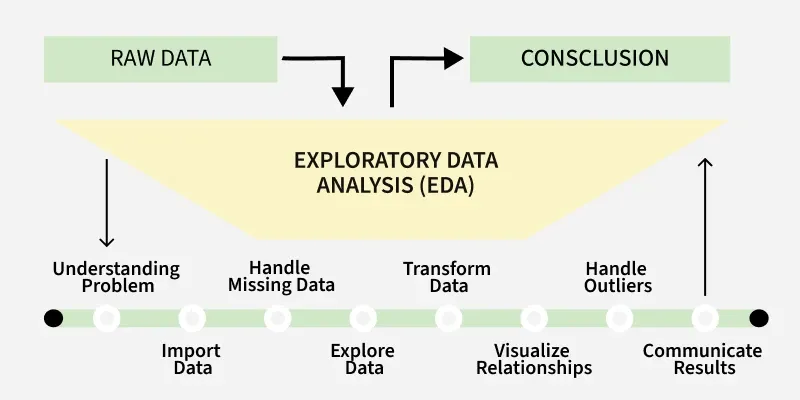
Figure: Overview of the Exploratory Data Analysis process, from inspection and cleaning to visualization and insight.
Understanding data is a process, not a single action. Each step builds on the previous one, gradually refining understanding. The process is iterative rather than strictly linear.
Defining the Objective and the Key Variable#
Every analysis begins with a question. Without a clear objective, exploration becomes unfocused.
Most datasets contain one variable representing the primary outcome of interest, often called the target variable or key variable. Examples include survival, revenue, disease status, or performance. EDA seeks to understand:
how this variable behaves
how other variables relate to it
what factors may influence it
Asking the Right Questions#
Good analysis begins with good questions.
Two types of questions are especially powerful:
Variation within variables How does a single variable behave? What is its distribution? Range? Spread?
Co-variation between variables How do variables move together? Is there a relationship? A dependency?
Often one variable is central, and we examine how others relate to it.
Understanding both variation and co-variation is essential for meaningful analysis.
Understanding Data Structure#
Before analyzing anything, look at how the data is organized.
In any dataset, rows represent observations and columns represent attributes describing those observations. But sometimes the same individual appears multiple times, measured at different points in time. When data tracks changes across repeated measurements, it is called **longitudinal data **.
Consider a dataset tracking patients:
import pandas as pd

data = {
    "patient_id": [101, 101, 102, 102, 103],
    "visit_date": ["2024-01-01", "2024-02-01", "2024-01-05", "2024-02-05", "2024-01-10"],
    "age": [55, 55, 62, 62, 48],
    "weight": [180, 178, 165, 164, 150]
}

df = pd.DataFrame(data)
df
Notice that, Patient 101 appears multiple times because measurements were taken at different visits. Age stays the same, while weight changes over time. This shows that each row is an observation at a specific time point and each column is an attribute. Some variables are constant, others vary across visits.
Recognizing what is fixed and what changes is the foundation of exploratory data analysis.
Once we understand how the data is structured, the next step is to identify what kind of data each variable contains.
Understanding Variable Types#
Once we understand the structure of a dataset, the next question is:
What kind of data is each variable?
In Python, we can inspect technical data types using:
df.dtypes
Example Output#
patient_id     int64
visit_date     object
age            int64
weight         int64
However, a programming data type (such as int64 or object) is not the same as a statistical variable type. For analysis, we classify variables conceptually.
Continuous Variables (Quantitative): represent numeric measurements on a scale. Arithmetic operations are meaningful, and values can vary across a range.
Examples: age, weight, blood pressure
Typical summaries: mean, range, standard deviation, histograms, box plots.
Categorical Variables (Qualitative): represent group labels rather than numeric measurements.
Examples:gender, treatment group, cancer stage
Typical summaries:, frequency counts, proportions, bar charts
Different Roles of Variables:#
In addition to variable type (continuous or categorical), variables can also play different roles in a dataset.
Some variables uniquely identify individuals, some describe their starting characteristics, and others record measurements that change over time.
Identifier → uniquely labels an individual
Baseline variable → measured once at study start
Time-varying variable → measured repeatedly over time
Understanding both the type and the role of a variable helps determine how it should be analyzed.
Example from Our Dataset#
Variable |
Type |
Reason |
|---|---|---|
patient_id |
Identifier |
Labels a person |
visit_date |
Time variable |
Measurement moment |
age |
Baseline numeric |
Fixed characteristic |
weight |
Continuous |
Changes over time |